Immigrants from Europe vs Sioux Single Mother Households
COMPARE
Immigrants from Europe
Sioux
Single Mother Households
Single Mother Households Comparison
Immigrants from Europe
Sioux
5.5%
SINGLE MOTHER HOUSEHOLDS
99.0/ 100
METRIC RATING
57th/ 347
METRIC RANK
8.5%
SINGLE MOTHER HOUSEHOLDS
0.0/ 100
METRIC RATING
331st/ 347
METRIC RANK
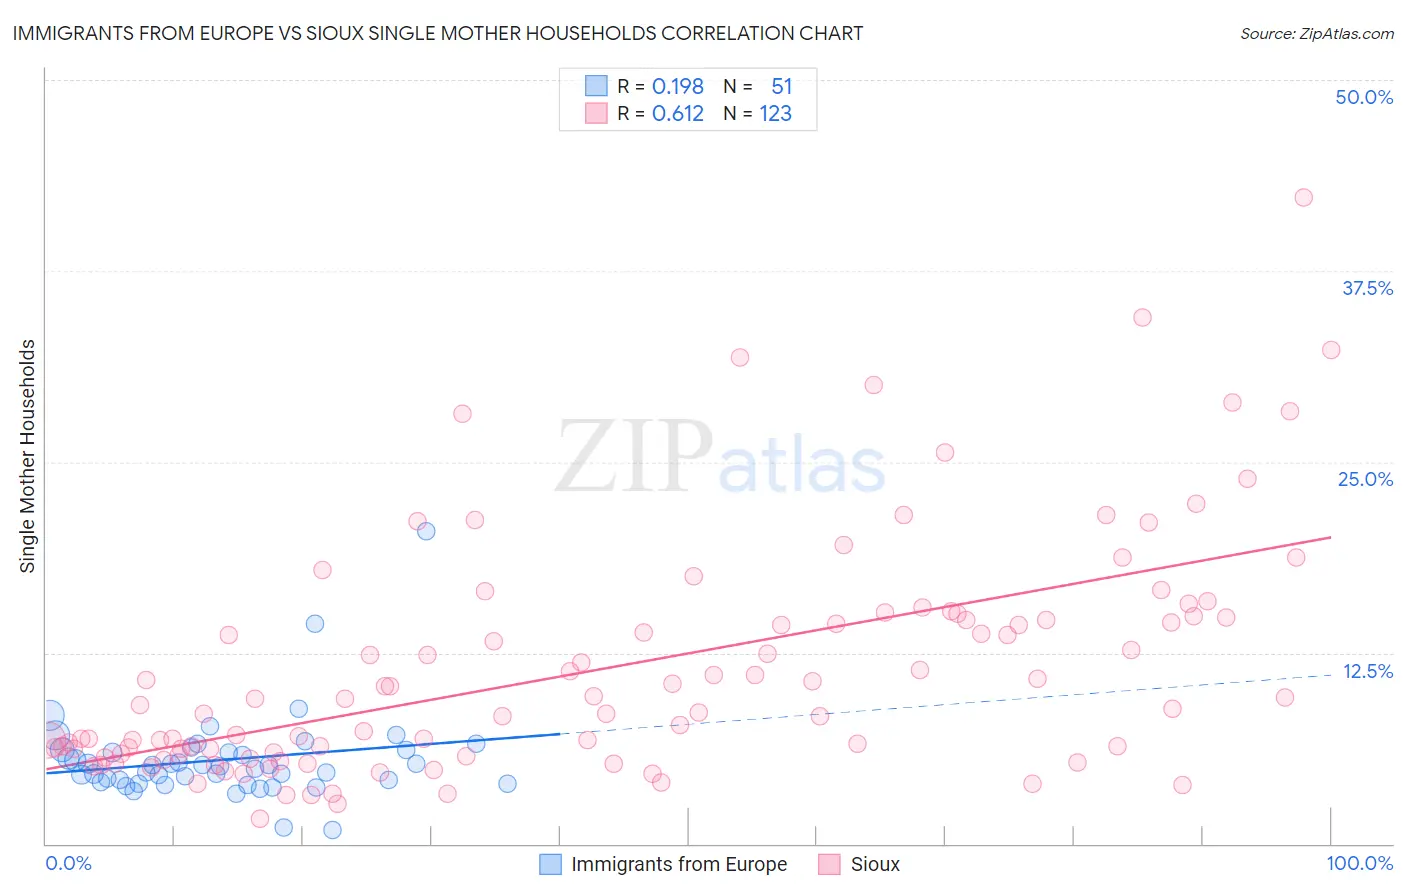
Immigrants from Europe vs Sioux Single Mother Households Correlation Chart
The statistical analysis conducted on geographies consisting of 543,439,256 people shows a poor positive correlation between the proportion of Immigrants from Europe and percentage of single mother households in the United States with a correlation coefficient (R) of 0.198 and weighted average of 5.5%. Similarly, the statistical analysis conducted on geographies consisting of 233,811,007 people shows a significant positive correlation between the proportion of Sioux and percentage of single mother households in the United States with a correlation coefficient (R) of 0.612 and weighted average of 8.5%, a difference of 53.8%.
Single Mother Households Correlation Summary
| Measurement | Immigrants from Europe | Sioux |
| Minimum | 0.93% | 1.6% |
| Maximum | 20.5% | 42.3% |
| Range | 19.6% | 40.7% |
| Mean | 5.5% | 11.4% |
| Median | 5.1% | 9.1% |
| Interquartile 25% (IQ1) | 4.0% | 5.9% |
| Interquartile 75% (IQ3) | 6.1% | 14.8% |
| Interquartile Range (IQR) | 2.1% | 8.9% |
| Standard Deviation (Sample) | 2.9% | 7.6% |
| Standard Deviation (Population) | 2.9% | 7.6% |
Similar Demographics by Single Mother Households
Demographics Similar to Immigrants from Europe by Single Mother Households
In terms of single mother households, the demographic groups most similar to Immigrants from Europe are Immigrants from Romania (5.5%, a difference of 0.080%), Immigrants from Denmark (5.5%, a difference of 0.15%), Danish (5.5%, a difference of 0.24%), Immigrants from Lebanon (5.5%, a difference of 0.32%), and Immigrants from Russia (5.5%, a difference of 0.34%).
| Demographics | Rating | Rank | Single Mother Households |
| Immigrants | Scotland | 99.2 /100 | #50 | Exceptional 5.5% |
| Immigrants | Belarus | 99.2 /100 | #51 | Exceptional 5.5% |
| Swedes | 99.1 /100 | #52 | Exceptional 5.5% |
| Immigrants | Russia | 99.1 /100 | #53 | Exceptional 5.5% |
| Immigrants | Lebanon | 99.1 /100 | #54 | Exceptional 5.5% |
| Immigrants | Denmark | 99.1 /100 | #55 | Exceptional 5.5% |
| Immigrants | Romania | 99.0 /100 | #56 | Exceptional 5.5% |
| Immigrants | Europe | 99.0 /100 | #57 | Exceptional 5.5% |
| Danes | 98.9 /100 | #58 | Exceptional 5.5% |
| Luxembourgers | 98.7 /100 | #59 | Exceptional 5.6% |
| Immigrants | Norway | 98.7 /100 | #60 | Exceptional 5.6% |
| Australians | 98.7 /100 | #61 | Exceptional 5.6% |
| Poles | 98.6 /100 | #62 | Exceptional 5.6% |
| Immigrants | North Macedonia | 98.6 /100 | #63 | Exceptional 5.6% |
| Immigrants | France | 98.6 /100 | #64 | Exceptional 5.6% |
Demographics Similar to Sioux by Single Mother Households
In terms of single mother households, the demographic groups most similar to Sioux are Inupiat (8.5%, a difference of 0.0%), Hopi (8.5%, a difference of 0.11%), Yakama (8.4%, a difference of 0.86%), Immigrants from Haiti (8.4%, a difference of 1.0%), and British West Indian (8.4%, a difference of 1.2%).
| Demographics | Rating | Rank | Single Mother Households |
| Immigrants | Jamaica | 0.0 /100 | #324 | Tragic 8.4% |
| Immigrants | Caribbean | 0.0 /100 | #325 | Tragic 8.4% |
| British West Indians | 0.0 /100 | #326 | Tragic 8.4% |
| Immigrants | Haiti | 0.0 /100 | #327 | Tragic 8.4% |
| Yakama | 0.0 /100 | #328 | Tragic 8.4% |
| Hopi | 0.0 /100 | #329 | Tragic 8.5% |
| Inupiat | 0.0 /100 | #330 | Tragic 8.5% |
| Sioux | 0.0 /100 | #331 | Tragic 8.5% |
| U.S. Virgin Islanders | 0.0 /100 | #332 | Tragic 8.6% |
| Liberians | 0.0 /100 | #333 | Tragic 8.6% |
| Immigrants | Liberia | 0.0 /100 | #334 | Tragic 8.7% |
| Immigrants | Dominica | 0.0 /100 | #335 | Tragic 8.7% |
| Puerto Ricans | 0.0 /100 | #336 | Tragic 8.7% |
| Navajo | 0.0 /100 | #337 | Tragic 8.8% |
| Cape Verdeans | 0.0 /100 | #338 | Tragic 8.9% |