Sudanese vs Sioux Single Mother Households
COMPARE
Sudanese
Sioux
Single Mother Households
Single Mother Households Comparison
Sudanese
Sioux
6.9%
SINGLE MOTHER HOUSEHOLDS
3.1/ 100
METRIC RATING
225th/ 347
METRIC RANK
8.5%
SINGLE MOTHER HOUSEHOLDS
0.0/ 100
METRIC RATING
331st/ 347
METRIC RANK
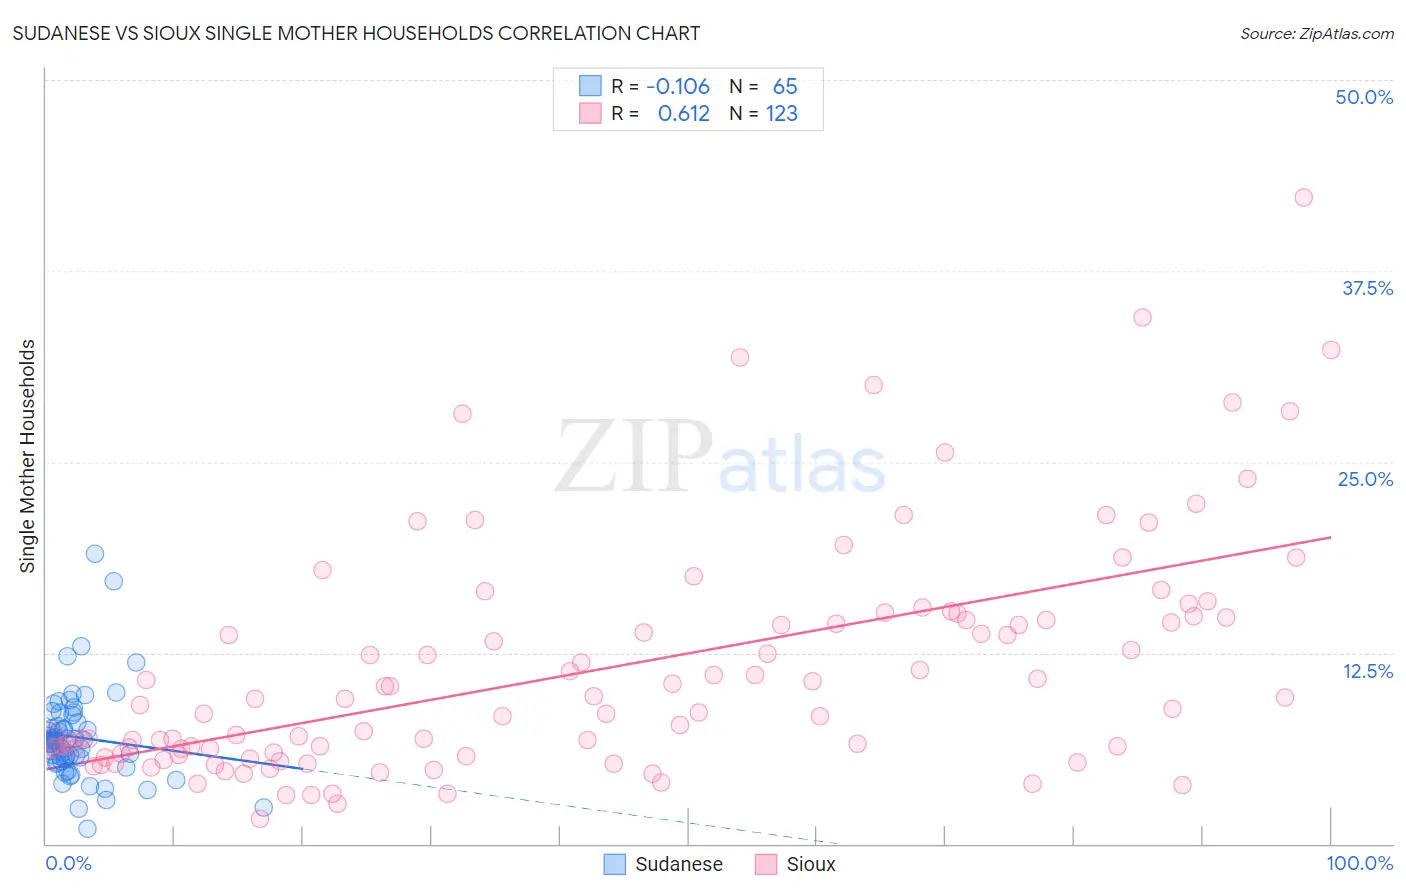
Sudanese vs Sioux Single Mother Households Correlation Chart
The statistical analysis conducted on geographies consisting of 110,049,727 people shows a poor negative correlation between the proportion of Sudanese and percentage of single mother households in the United States with a correlation coefficient (R) of -0.106 and weighted average of 6.9%. Similarly, the statistical analysis conducted on geographies consisting of 233,811,007 people shows a significant positive correlation between the proportion of Sioux and percentage of single mother households in the United States with a correlation coefficient (R) of 0.612 and weighted average of 8.5%, a difference of 22.9%.
Single Mother Households Correlation Summary
| Measurement | Sudanese | Sioux |
| Minimum | 1.0% | 1.6% |
| Maximum | 19.0% | 42.3% |
| Range | 18.0% | 40.7% |
| Mean | 7.0% | 11.4% |
| Median | 6.7% | 9.1% |
| Interquartile 25% (IQ1) | 5.4% | 5.9% |
| Interquartile 75% (IQ3) | 8.2% | 14.8% |
| Interquartile Range (IQR) | 2.8% | 8.9% |
| Standard Deviation (Sample) | 3.0% | 7.6% |
| Standard Deviation (Population) | 3.0% | 7.6% |
Similar Demographics by Single Mother Households
Demographics Similar to Sudanese by Single Mother Households
In terms of single mother households, the demographic groups most similar to Sudanese are Immigrants from Sudan (6.9%, a difference of 0.27%), Immigrants from Micronesia (6.9%, a difference of 0.39%), Immigrants from Bangladesh (6.9%, a difference of 0.44%), French American Indian (6.9%, a difference of 0.47%), and Immigrants from Thailand (6.9%, a difference of 0.66%).
| Demographics | Rating | Rank | Single Mother Households |
| Immigrants | Eastern Africa | 4.4 /100 | #218 | Tragic 6.8% |
| Immigrants | Immigrants | 4.3 /100 | #219 | Tragic 6.8% |
| Immigrants | Thailand | 4.0 /100 | #220 | Tragic 6.9% |
| French American Indians | 3.7 /100 | #221 | Tragic 6.9% |
| Immigrants | Bangladesh | 3.7 /100 | #222 | Tragic 6.9% |
| Immigrants | Micronesia | 3.6 /100 | #223 | Tragic 6.9% |
| Immigrants | Sudan | 3.5 /100 | #224 | Tragic 6.9% |
| Sudanese | 3.1 /100 | #225 | Tragic 6.9% |
| Paiute | 2.4 /100 | #226 | Tragic 7.0% |
| Kenyans | 2.3 /100 | #227 | Tragic 7.0% |
| Iroquois | 2.2 /100 | #228 | Tragic 7.0% |
| Immigrants | Kenya | 2.1 /100 | #229 | Tragic 7.0% |
| Creek | 1.6 /100 | #230 | Tragic 7.0% |
| Spanish Americans | 1.6 /100 | #231 | Tragic 7.0% |
| Comanche | 1.5 /100 | #232 | Tragic 7.0% |
Demographics Similar to Sioux by Single Mother Households
In terms of single mother households, the demographic groups most similar to Sioux are Inupiat (8.5%, a difference of 0.0%), Hopi (8.5%, a difference of 0.11%), Yakama (8.4%, a difference of 0.86%), Immigrants from Haiti (8.4%, a difference of 1.0%), and British West Indian (8.4%, a difference of 1.2%).
| Demographics | Rating | Rank | Single Mother Households |
| Immigrants | Jamaica | 0.0 /100 | #324 | Tragic 8.4% |
| Immigrants | Caribbean | 0.0 /100 | #325 | Tragic 8.4% |
| British West Indians | 0.0 /100 | #326 | Tragic 8.4% |
| Immigrants | Haiti | 0.0 /100 | #327 | Tragic 8.4% |
| Yakama | 0.0 /100 | #328 | Tragic 8.4% |
| Hopi | 0.0 /100 | #329 | Tragic 8.5% |
| Inupiat | 0.0 /100 | #330 | Tragic 8.5% |
| Sioux | 0.0 /100 | #331 | Tragic 8.5% |
| U.S. Virgin Islanders | 0.0 /100 | #332 | Tragic 8.6% |
| Liberians | 0.0 /100 | #333 | Tragic 8.6% |
| Immigrants | Liberia | 0.0 /100 | #334 | Tragic 8.7% |
| Immigrants | Dominica | 0.0 /100 | #335 | Tragic 8.7% |
| Puerto Ricans | 0.0 /100 | #336 | Tragic 8.7% |
| Navajo | 0.0 /100 | #337 | Tragic 8.8% |
| Cape Verdeans | 0.0 /100 | #338 | Tragic 8.9% |