Immigrants from Europe vs Luxembourger Single Mother Households
COMPARE
Immigrants from Europe
Luxembourger
Single Mother Households
Single Mother Households Comparison
Immigrants from Europe
Luxembourgers
5.5%
SINGLE MOTHER HOUSEHOLDS
99.0/ 100
METRIC RATING
57th/ 347
METRIC RANK
5.6%
SINGLE MOTHER HOUSEHOLDS
98.7/ 100
METRIC RATING
59th/ 347
METRIC RANK
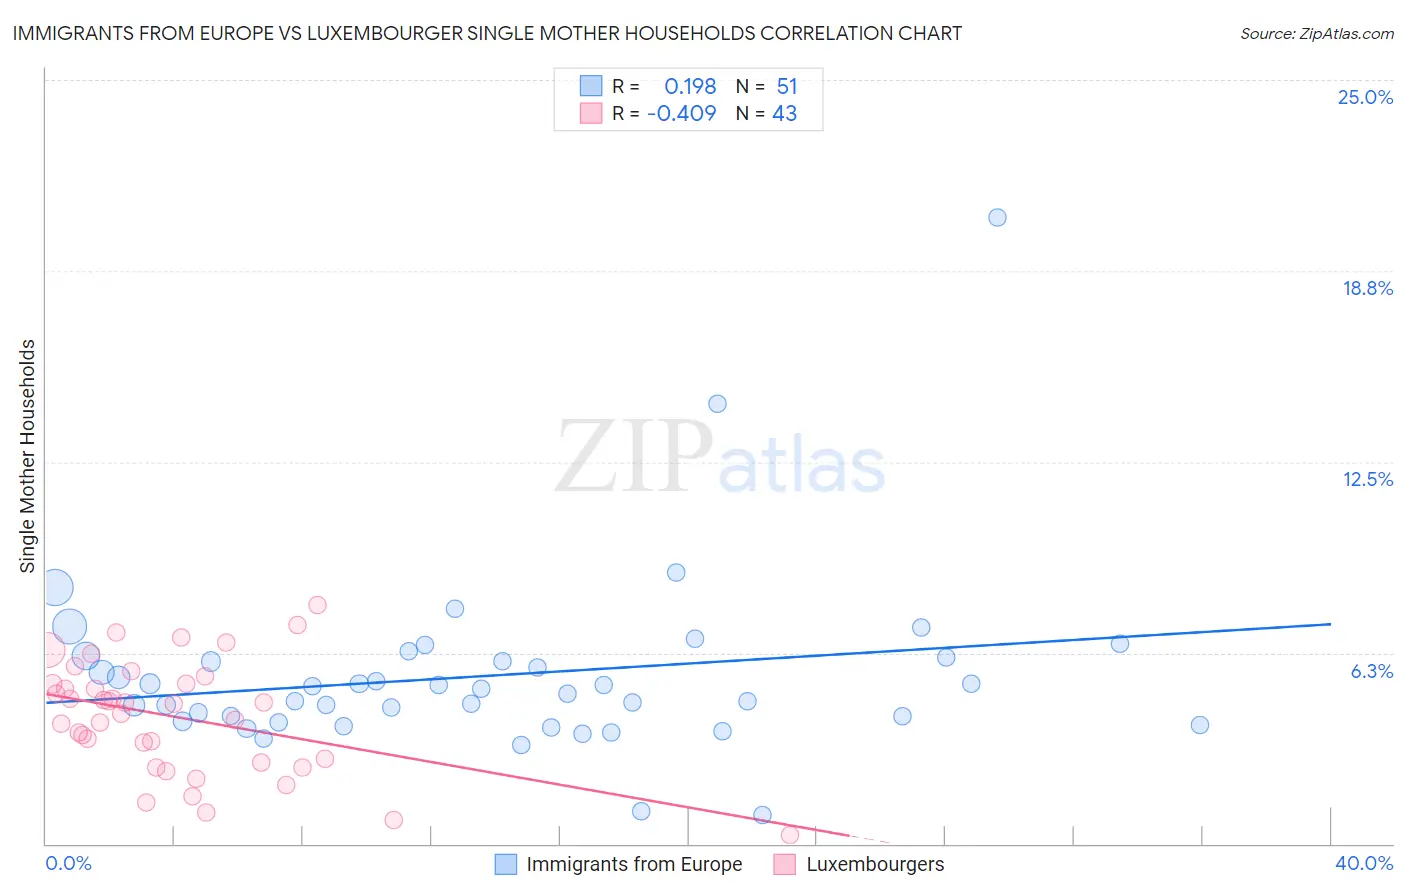
Immigrants from Europe vs Luxembourger Single Mother Households Correlation Chart
The statistical analysis conducted on geographies consisting of 543,439,256 people shows a poor positive correlation between the proportion of Immigrants from Europe and percentage of single mother households in the United States with a correlation coefficient (R) of 0.198 and weighted average of 5.5%. Similarly, the statistical analysis conducted on geographies consisting of 144,304,959 people shows a moderate negative correlation between the proportion of Luxembourgers and percentage of single mother households in the United States with a correlation coefficient (R) of -0.409 and weighted average of 5.6%, a difference of 0.75%.
Single Mother Households Correlation Summary
| Measurement | Immigrants from Europe | Luxembourger |
| Minimum | 0.93% | 0.28% |
| Maximum | 20.5% | 7.8% |
| Range | 19.6% | 7.5% |
| Mean | 5.5% | 4.1% |
| Median | 5.1% | 4.6% |
| Interquartile 25% (IQ1) | 4.0% | 2.7% |
| Interquartile 75% (IQ3) | 6.1% | 5.2% |
| Interquartile Range (IQR) | 2.1% | 2.5% |
| Standard Deviation (Sample) | 2.9% | 1.8% |
| Standard Deviation (Population) | 2.9% | 1.8% |
Demographics Similar to Immigrants from Europe and Luxembourgers by Single Mother Households
In terms of single mother households, the demographic groups most similar to Immigrants from Europe are Immigrants from Romania (5.5%, a difference of 0.080%), Immigrants from Denmark (5.5%, a difference of 0.15%), Danish (5.5%, a difference of 0.24%), Immigrants from Lebanon (5.5%, a difference of 0.32%), and Immigrants from Russia (5.5%, a difference of 0.34%). Similarly, the demographic groups most similar to Luxembourgers are Immigrants from Norway (5.6%, a difference of 0.15%), Australian (5.6%, a difference of 0.22%), Polish (5.6%, a difference of 0.23%), Immigrants from North Macedonia (5.6%, a difference of 0.29%), and Immigrants from France (5.6%, a difference of 0.33%).
| Demographics | Rating | Rank | Single Mother Households |
| Turks | 99.2 /100 | #48 | Exceptional 5.5% |
| Immigrants | Latvia | 99.2 /100 | #49 | Exceptional 5.5% |
| Immigrants | Scotland | 99.2 /100 | #50 | Exceptional 5.5% |
| Immigrants | Belarus | 99.2 /100 | #51 | Exceptional 5.5% |
| Swedes | 99.1 /100 | #52 | Exceptional 5.5% |
| Immigrants | Russia | 99.1 /100 | #53 | Exceptional 5.5% |
| Immigrants | Lebanon | 99.1 /100 | #54 | Exceptional 5.5% |
| Immigrants | Denmark | 99.1 /100 | #55 | Exceptional 5.5% |
| Immigrants | Romania | 99.0 /100 | #56 | Exceptional 5.5% |
| Immigrants | Europe | 99.0 /100 | #57 | Exceptional 5.5% |
| Danes | 98.9 /100 | #58 | Exceptional 5.5% |
| Luxembourgers | 98.7 /100 | #59 | Exceptional 5.6% |
| Immigrants | Norway | 98.7 /100 | #60 | Exceptional 5.6% |
| Australians | 98.7 /100 | #61 | Exceptional 5.6% |
| Poles | 98.6 /100 | #62 | Exceptional 5.6% |
| Immigrants | North Macedonia | 98.6 /100 | #63 | Exceptional 5.6% |
| Immigrants | France | 98.6 /100 | #64 | Exceptional 5.6% |
| Greeks | 98.6 /100 | #65 | Exceptional 5.6% |
| Immigrants | Canada | 98.5 /100 | #66 | Exceptional 5.6% |
| Italians | 98.5 /100 | #67 | Exceptional 5.6% |
| Immigrants | Bulgaria | 98.5 /100 | #68 | Exceptional 5.6% |