Immigrants from Eritrea vs Hawaiian Divorced or Separated
COMPARE
Immigrants from Eritrea
Hawaiian
Divorced or Separated
Divorced or Separated Comparison
Immigrants from Eritrea
Hawaiians
12.1%
DIVORCED OR SEPARATED
31.9/ 100
METRIC RATING
194th/ 347
METRIC RANK
12.1%
DIVORCED OR SEPARATED
50.0/ 100
METRIC RATING
174th/ 347
METRIC RANK
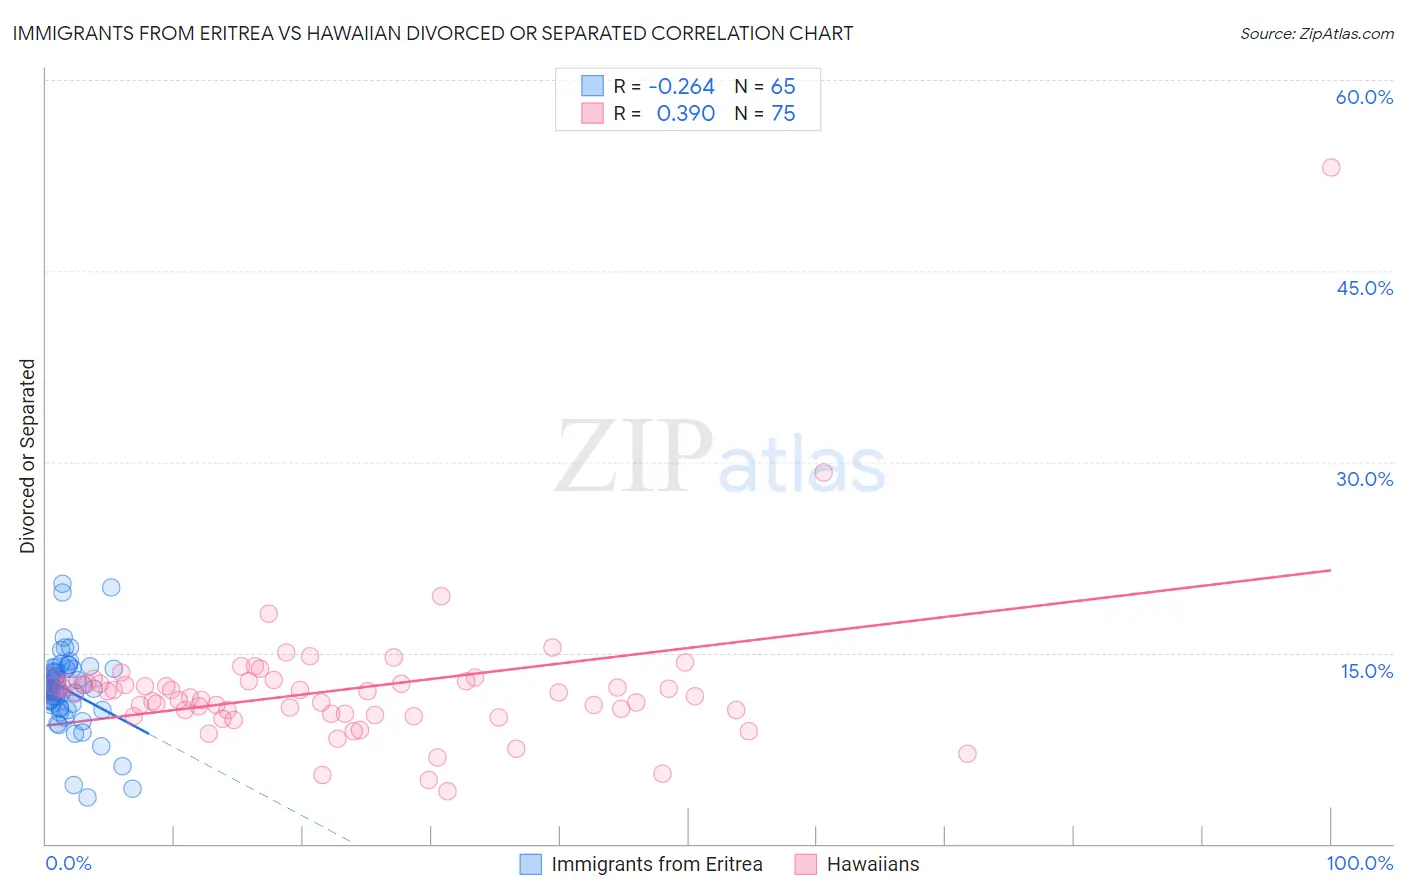
Immigrants from Eritrea vs Hawaiian Divorced or Separated Correlation Chart
The statistical analysis conducted on geographies consisting of 104,847,630 people shows a weak negative correlation between the proportion of Immigrants from Eritrea and percentage of population currently divorced or separated in the United States with a correlation coefficient (R) of -0.264 and weighted average of 12.1%. Similarly, the statistical analysis conducted on geographies consisting of 327,516,248 people shows a mild positive correlation between the proportion of Hawaiians and percentage of population currently divorced or separated in the United States with a correlation coefficient (R) of 0.390 and weighted average of 12.1%, a difference of 0.66%.
Divorced or Separated Correlation Summary
| Measurement | Immigrants from Eritrea | Hawaiian |
| Minimum | 3.6% | 4.1% |
| Maximum | 20.5% | 53.1% |
| Range | 16.9% | 49.0% |
| Mean | 12.1% | 12.1% |
| Median | 12.2% | 11.8% |
| Interquartile 25% (IQ1) | 10.8% | 10.2% |
| Interquartile 75% (IQ3) | 13.7% | 12.7% |
| Interquartile Range (IQR) | 2.9% | 2.5% |
| Standard Deviation (Sample) | 3.1% | 5.8% |
| Standard Deviation (Population) | 3.0% | 5.8% |
Demographics Similar to Immigrants from Eritrea and Hawaiians by Divorced or Separated
In terms of divorced or separated, the demographic groups most similar to Immigrants from Eritrea are Immigrants from Thailand (12.1%, a difference of 0.020%), Norwegian (12.1%, a difference of 0.050%), Swedish (12.1%, a difference of 0.10%), Moroccan (12.1%, a difference of 0.11%), and Sierra Leonean (12.1%, a difference of 0.14%). Similarly, the demographic groups most similar to Hawaiians are Immigrants from Sierra Leone (12.1%, a difference of 0.0%), Pennsylvania German (12.1%, a difference of 0.040%), Brazilian (12.1%, a difference of 0.080%), Ghanaian (12.1%, a difference of 0.14%), and Immigrants from Western Europe (12.1%, a difference of 0.15%).
| Demographics | Rating | Rank | Divorced or Separated |
| Hawaiians | 50.0 /100 | #174 | Average 12.1% |
| Immigrants | Sierra Leone | 50.0 /100 | #175 | Average 12.1% |
| Pennsylvania Germans | 48.9 /100 | #176 | Average 12.1% |
| Brazilians | 47.7 /100 | #177 | Average 12.1% |
| Ghanaians | 45.9 /100 | #178 | Average 12.1% |
| Immigrants | Western Europe | 45.6 /100 | #179 | Average 12.1% |
| Barbadians | 45.0 /100 | #180 | Average 12.1% |
| Immigrants | Canada | 44.0 /100 | #181 | Average 12.1% |
| Immigrants | Ethiopia | 43.1 /100 | #182 | Average 12.1% |
| Immigrants | Central America | 42.9 /100 | #183 | Average 12.1% |
| Immigrants | North America | 41.1 /100 | #184 | Average 12.1% |
| Immigrants | Nigeria | 40.5 /100 | #185 | Average 12.1% |
| Immigrants | Chile | 39.0 /100 | #186 | Fair 12.1% |
| Belizeans | 37.7 /100 | #187 | Fair 12.1% |
| Immigrants | Belize | 37.6 /100 | #188 | Fair 12.1% |
| Sierra Leoneans | 35.5 /100 | #189 | Fair 12.1% |
| Moroccans | 34.8 /100 | #190 | Fair 12.1% |
| Swedes | 34.4 /100 | #191 | Fair 12.1% |
| Norwegians | 33.2 /100 | #192 | Fair 12.1% |
| Immigrants | Thailand | 32.5 /100 | #193 | Fair 12.1% |
| Immigrants | Eritrea | 31.9 /100 | #194 | Fair 12.1% |