Yup'ik vs Nepalese Divorced or Separated
COMPARE
Yup'ik
Nepalese
Divorced or Separated
Divorced or Separated Comparison
Yup'ik
Nepalese
10.3%
DIVORCED OR SEPARATED
100.0/ 100
METRIC RATING
9th/ 347
METRIC RANK
12.5%
DIVORCED OR SEPARATED
1.8/ 100
METRIC RATING
248th/ 347
METRIC RANK
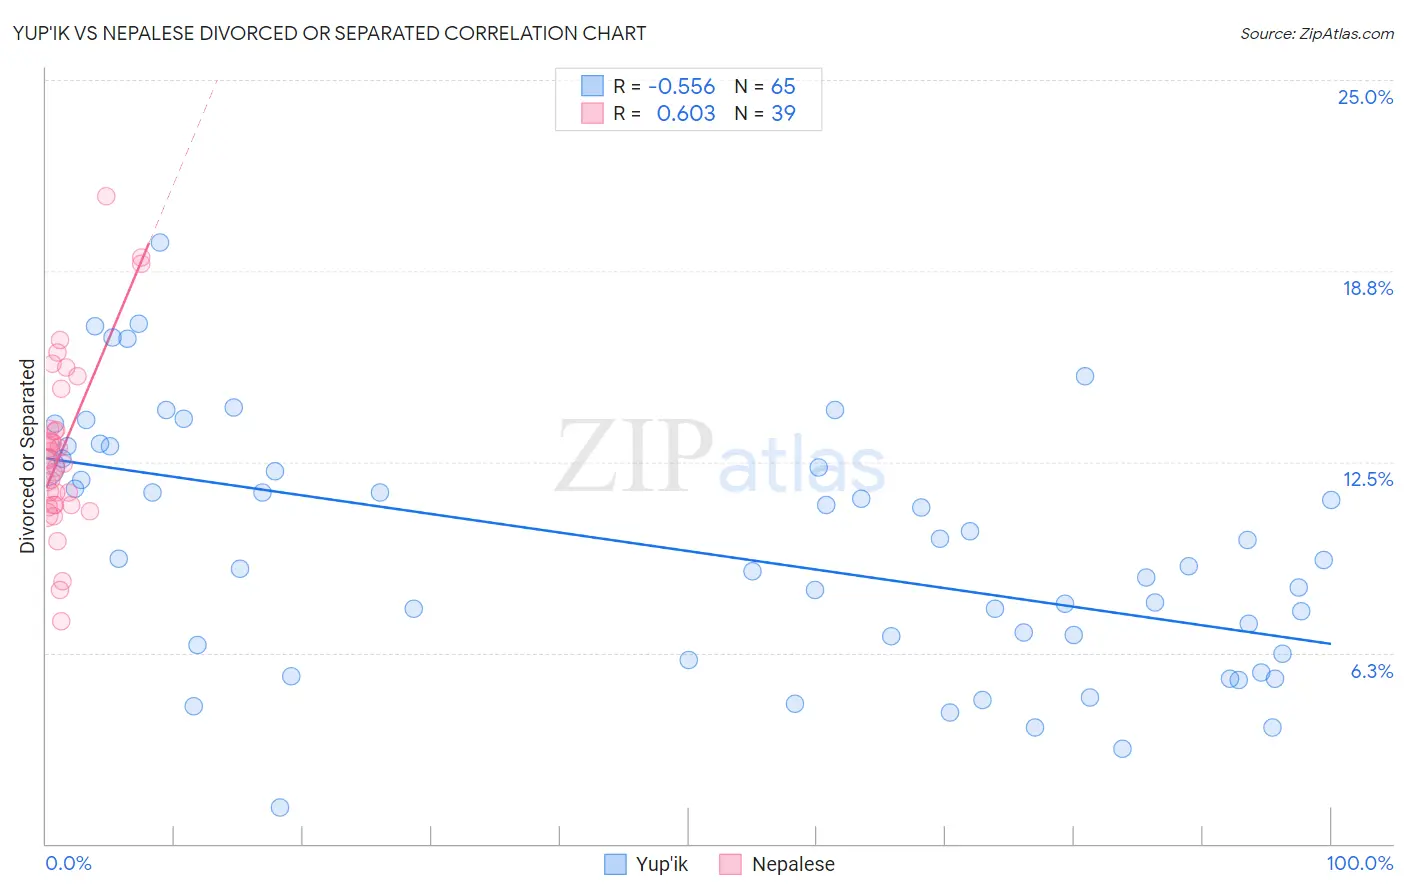
Yup'ik vs Nepalese Divorced or Separated Correlation Chart
The statistical analysis conducted on geographies consisting of 39,962,482 people shows a substantial negative correlation between the proportion of Yup'ik and percentage of population currently divorced or separated in the United States with a correlation coefficient (R) of -0.556 and weighted average of 10.3%. Similarly, the statistical analysis conducted on geographies consisting of 24,519,269 people shows a significant positive correlation between the proportion of Nepalese and percentage of population currently divorced or separated in the United States with a correlation coefficient (R) of 0.603 and weighted average of 12.5%, a difference of 21.3%.
Divorced or Separated Correlation Summary
| Measurement | Yup'ik | Nepalese |
| Minimum | 1.2% | 7.3% |
| Maximum | 19.7% | 21.2% |
| Range | 18.5% | 13.9% |
| Mean | 9.6% | 12.9% |
| Median | 9.3% | 12.6% |
| Interquartile 25% (IQ1) | 6.4% | 11.1% |
| Interquartile 75% (IQ3) | 12.5% | 13.6% |
| Interquartile Range (IQR) | 6.1% | 2.5% |
| Standard Deviation (Sample) | 4.0% | 2.9% |
| Standard Deviation (Population) | 4.0% | 2.8% |
Similar Demographics by Divorced or Separated
Demographics Similar to Yup'ik by Divorced or Separated
In terms of divorced or separated, the demographic groups most similar to Yup'ik are Immigrants from Eastern Asia (10.2%, a difference of 0.44%), Immigrants from Singapore (10.3%, a difference of 0.53%), Thai (10.2%, a difference of 0.78%), Indian (Asian) (10.2%, a difference of 0.83%), and Immigrants from South Central Asia (10.4%, a difference of 1.5%).
| Demographics | Rating | Rank | Divorced or Separated |
| Filipinos | 100.0 /100 | #2 | Exceptional 9.9% |
| Immigrants | Hong Kong | 100.0 /100 | #3 | Exceptional 10.0% |
| Immigrants | China | 100.0 /100 | #4 | Exceptional 10.0% |
| Immigrants | India | 100.0 /100 | #5 | Exceptional 10.1% |
| Indians (Asian) | 100.0 /100 | #6 | Exceptional 10.2% |
| Thais | 100.0 /100 | #7 | Exceptional 10.2% |
| Immigrants | Eastern Asia | 100.0 /100 | #8 | Exceptional 10.2% |
| Yup'ik | 100.0 /100 | #9 | Exceptional 10.3% |
| Immigrants | Singapore | 100.0 /100 | #10 | Exceptional 10.3% |
| Immigrants | South Central Asia | 100.0 /100 | #11 | Exceptional 10.4% |
| Okinawans | 100.0 /100 | #12 | Exceptional 10.5% |
| Cypriots | 100.0 /100 | #13 | Exceptional 10.5% |
| Assyrians/Chaldeans/Syriacs | 100.0 /100 | #14 | Exceptional 10.6% |
| Immigrants | Armenia | 100.0 /100 | #15 | Exceptional 10.6% |
| Immigrants | Korea | 100.0 /100 | #16 | Exceptional 10.6% |
Demographics Similar to Nepalese by Divorced or Separated
In terms of divorced or separated, the demographic groups most similar to Nepalese are Finnish (12.5%, a difference of 0.010%), German (12.5%, a difference of 0.020%), Immigrants from West Indies (12.5%, a difference of 0.060%), Hispanic or Latino (12.5%, a difference of 0.080%), and Irish (12.5%, a difference of 0.29%).
| Demographics | Rating | Rank | Divorced or Separated |
| Uruguayans | 3.4 /100 | #241 | Tragic 12.4% |
| Dutch | 3.1 /100 | #242 | Tragic 12.4% |
| Immigrants | Latin America | 2.8 /100 | #243 | Tragic 12.4% |
| Alaska Natives | 2.5 /100 | #244 | Tragic 12.4% |
| Hispanics or Latinos | 2.0 /100 | #245 | Tragic 12.5% |
| Immigrants | West Indies | 1.9 /100 | #246 | Tragic 12.5% |
| Germans | 1.8 /100 | #247 | Tragic 12.5% |
| Nepalese | 1.8 /100 | #248 | Tragic 12.5% |
| Finns | 1.8 /100 | #249 | Tragic 12.5% |
| Irish | 1.3 /100 | #250 | Tragic 12.5% |
| Aleuts | 1.3 /100 | #251 | Tragic 12.5% |
| Liberians | 0.9 /100 | #252 | Tragic 12.6% |
| Somalis | 0.9 /100 | #253 | Tragic 12.6% |
| Senegalese | 0.8 /100 | #254 | Tragic 12.6% |
| Welsh | 0.7 /100 | #255 | Tragic 12.6% |