Immigrants from El Salvador vs Romanian Family Households with Children
COMPARE
Immigrants from El Salvador
Romanian
Family Households with Children
Family Households with Children Comparison
Immigrants from El Salvador
Romanians
29.8%
FAMILY HOUSEHOLDS WITH CHILDREN
100.0/ 100
METRIC RATING
20th/ 347
METRIC RANK
27.6%
FAMILY HOUSEHOLDS WITH CHILDREN
70.8/ 100
METRIC RATING
158th/ 347
METRIC RANK
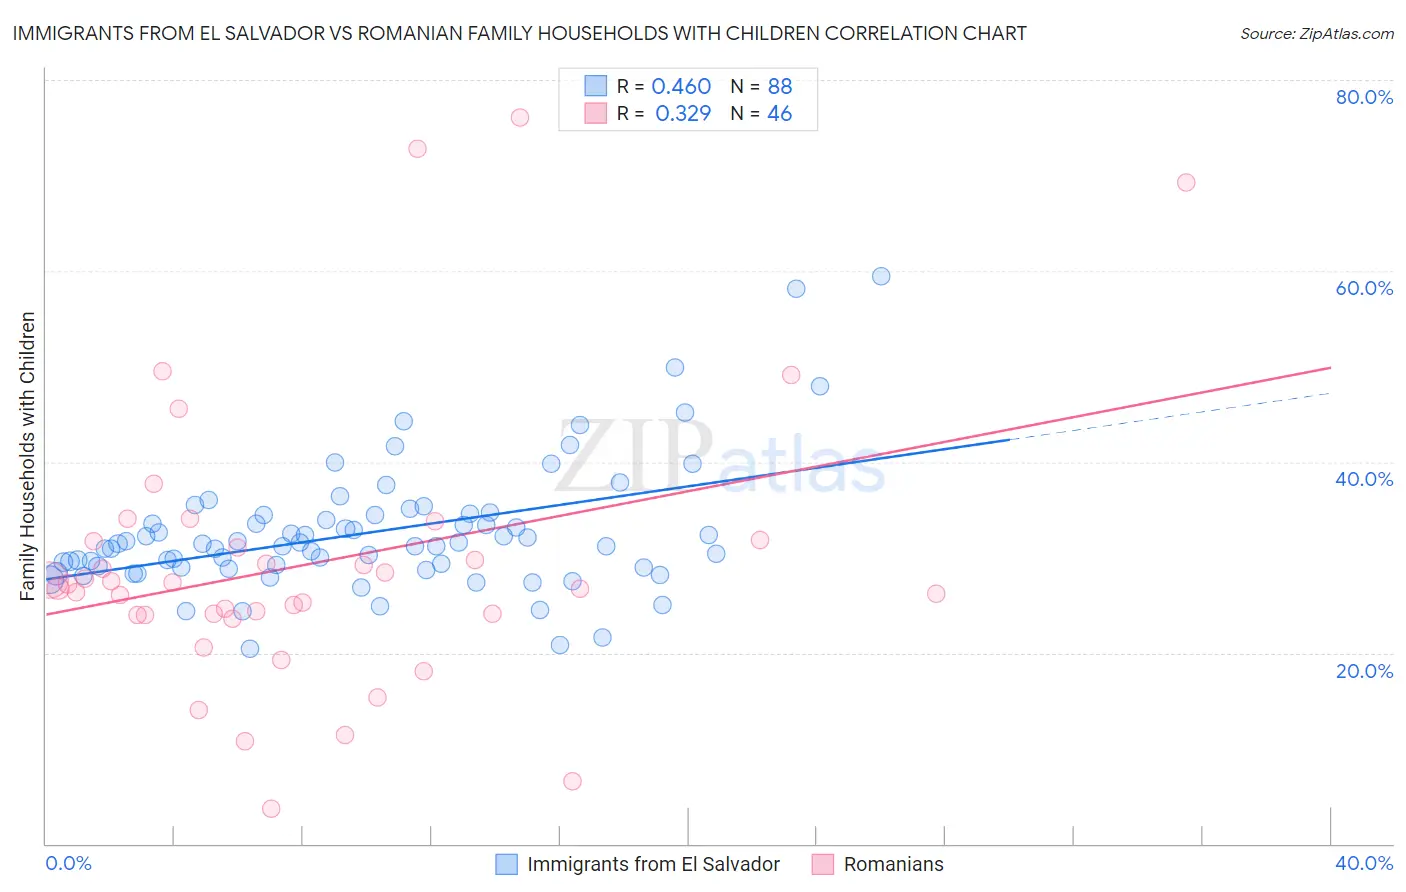
Immigrants from El Salvador vs Romanian Family Households with Children Correlation Chart
The statistical analysis conducted on geographies consisting of 357,693,956 people shows a moderate positive correlation between the proportion of Immigrants from El Salvador and percentage of family households with children in the United States with a correlation coefficient (R) of 0.460 and weighted average of 29.8%. Similarly, the statistical analysis conducted on geographies consisting of 377,533,387 people shows a mild positive correlation between the proportion of Romanians and percentage of family households with children in the United States with a correlation coefficient (R) of 0.329 and weighted average of 27.6%, a difference of 8.2%.
Family Households with Children Correlation Summary
| Measurement | Immigrants from El Salvador | Romanian |
| Minimum | 20.5% | 3.7% |
| Maximum | 59.5% | 76.1% |
| Range | 39.0% | 72.4% |
| Mean | 32.6% | 29.3% |
| Median | 31.3% | 27.0% |
| Interquartile 25% (IQ1) | 29.0% | 24.0% |
| Interquartile 75% (IQ3) | 34.5% | 31.7% |
| Interquartile Range (IQR) | 5.5% | 7.7% |
| Standard Deviation (Sample) | 6.7% | 14.7% |
| Standard Deviation (Population) | 6.7% | 14.6% |
Similar Demographics by Family Households with Children
Demographics Similar to Immigrants from El Salvador by Family Households with Children
In terms of family households with children, the demographic groups most similar to Immigrants from El Salvador are Alaska Native (29.9%, a difference of 0.030%), Immigrants from Laos (29.8%, a difference of 0.040%), Salvadoran (29.9%, a difference of 0.070%), Malaysian (29.8%, a difference of 0.080%), and Hispanic or Latino (29.9%, a difference of 0.25%).
| Demographics | Rating | Rank | Family Households with Children |
| Afghans | 100.0 /100 | #13 | Exceptional 30.2% |
| Bangladeshis | 100.0 /100 | #14 | Exceptional 30.1% |
| Immigrants | South Central Asia | 100.0 /100 | #15 | Exceptional 30.0% |
| Immigrants | Afghanistan | 100.0 /100 | #16 | Exceptional 30.0% |
| Hispanics or Latinos | 100.0 /100 | #17 | Exceptional 29.9% |
| Salvadorans | 100.0 /100 | #18 | Exceptional 29.9% |
| Alaska Natives | 100.0 /100 | #19 | Exceptional 29.9% |
| Immigrants | El Salvador | 100.0 /100 | #20 | Exceptional 29.8% |
| Immigrants | Laos | 100.0 /100 | #21 | Exceptional 29.8% |
| Malaysians | 100.0 /100 | #22 | Exceptional 29.8% |
| Mexican American Indians | 100.0 /100 | #23 | Exceptional 29.7% |
| Guamanians/Chamorros | 100.0 /100 | #24 | Exceptional 29.7% |
| Immigrants | Latin America | 100.0 /100 | #25 | Exceptional 29.7% |
| Sri Lankans | 100.0 /100 | #26 | Exceptional 29.5% |
| Immigrants | Vietnam | 100.0 /100 | #27 | Exceptional 29.5% |
Demographics Similar to Romanians by Family Households with Children
In terms of family households with children, the demographic groups most similar to Romanians are Mongolian (27.6%, a difference of 0.0%), Indian (Asian) (27.6%, a difference of 0.020%), Subsaharan African (27.6%, a difference of 0.080%), Alaskan Athabascan (27.6%, a difference of 0.090%), and Immigrants from Bangladesh (27.6%, a difference of 0.10%).
| Demographics | Rating | Rank | Family Households with Children |
| Portuguese | 77.8 /100 | #151 | Good 27.6% |
| Ethiopians | 77.0 /100 | #152 | Good 27.6% |
| Immigrants | Cabo Verde | 75.6 /100 | #153 | Good 27.6% |
| Icelanders | 75.3 /100 | #154 | Good 27.6% |
| Comanche | 74.8 /100 | #155 | Good 27.6% |
| Hungarians | 74.6 /100 | #156 | Good 27.6% |
| Indians (Asian) | 71.6 /100 | #157 | Good 27.6% |
| Romanians | 70.8 /100 | #158 | Good 27.6% |
| Mongolians | 70.7 /100 | #159 | Good 27.6% |
| Sub-Saharan Africans | 67.5 /100 | #160 | Good 27.6% |
| Alaskan Athabascans | 67.1 /100 | #161 | Good 27.6% |
| Immigrants | Bangladesh | 67.0 /100 | #162 | Good 27.6% |
| Czechs | 65.3 /100 | #163 | Good 27.5% |
| Immigrants | Hong Kong | 64.9 /100 | #164 | Good 27.5% |
| Immigrants | South Africa | 61.3 /100 | #165 | Good 27.5% |