Bermudan vs Romanian Family Households with Children
COMPARE
Bermudan
Romanian
Family Households with Children
Family Households with Children Comparison
Bermudans
Romanians
26.3%
FAMILY HOUSEHOLDS WITH CHILDREN
0.1/ 100
METRIC RATING
306th/ 347
METRIC RANK
27.6%
FAMILY HOUSEHOLDS WITH CHILDREN
70.8/ 100
METRIC RATING
158th/ 347
METRIC RANK
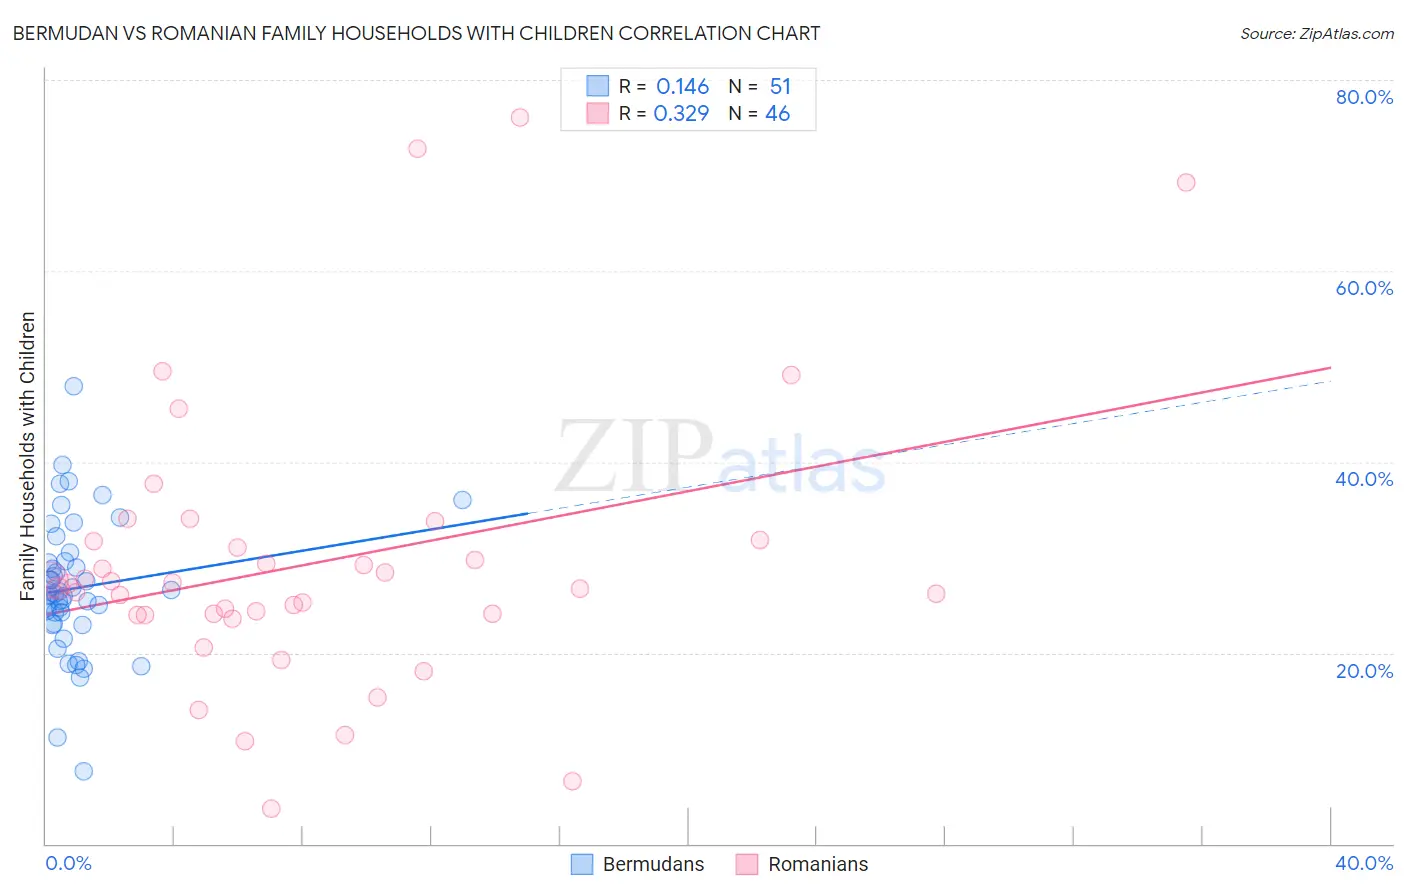
Bermudan vs Romanian Family Households with Children Correlation Chart
The statistical analysis conducted on geographies consisting of 55,716,155 people shows a poor positive correlation between the proportion of Bermudans and percentage of family households with children in the United States with a correlation coefficient (R) of 0.146 and weighted average of 26.3%. Similarly, the statistical analysis conducted on geographies consisting of 377,533,387 people shows a mild positive correlation between the proportion of Romanians and percentage of family households with children in the United States with a correlation coefficient (R) of 0.329 and weighted average of 27.6%, a difference of 4.8%.
Family Households with Children Correlation Summary
| Measurement | Bermudan | Romanian |
| Minimum | 7.6% | 3.7% |
| Maximum | 47.9% | 76.1% |
| Range | 40.3% | 72.4% |
| Mean | 26.8% | 29.3% |
| Median | 26.2% | 27.0% |
| Interquartile 25% (IQ1) | 23.0% | 24.0% |
| Interquartile 75% (IQ3) | 29.6% | 31.7% |
| Interquartile Range (IQR) | 6.5% | 7.7% |
| Standard Deviation (Sample) | 7.1% | 14.7% |
| Standard Deviation (Population) | 7.0% | 14.6% |
Similar Demographics by Family Households with Children
Demographics Similar to Bermudans by Family Households with Children
In terms of family households with children, the demographic groups most similar to Bermudans are Guyanese (26.3%, a difference of 0.010%), Immigrants from Bahamas (26.3%, a difference of 0.040%), West Indian (26.3%, a difference of 0.080%), Immigrants from Guyana (26.3%, a difference of 0.090%), and Lumbee (26.3%, a difference of 0.10%).
| Demographics | Rating | Rank | Family Households with Children |
| Trinidadians and Tobagonians | 0.1 /100 | #299 | Tragic 26.4% |
| Paiute | 0.1 /100 | #300 | Tragic 26.4% |
| Immigrants | Trinidad and Tobago | 0.1 /100 | #301 | Tragic 26.4% |
| Serbians | 0.1 /100 | #302 | Tragic 26.4% |
| Immigrants | Guyana | 0.1 /100 | #303 | Tragic 26.3% |
| Immigrants | Bahamas | 0.1 /100 | #304 | Tragic 26.3% |
| Guyanese | 0.1 /100 | #305 | Tragic 26.3% |
| Bermudans | 0.1 /100 | #306 | Tragic 26.3% |
| West Indians | 0.0 /100 | #307 | Tragic 26.3% |
| Lumbee | 0.0 /100 | #308 | Tragic 26.3% |
| Immigrants | Somalia | 0.0 /100 | #309 | Tragic 26.3% |
| Marshallese | 0.0 /100 | #310 | Tragic 26.2% |
| Colville | 0.0 /100 | #311 | Tragic 26.2% |
| Immigrants | Czechoslovakia | 0.0 /100 | #312 | Tragic 26.2% |
| Cree | 0.0 /100 | #313 | Tragic 26.2% |
Demographics Similar to Romanians by Family Households with Children
In terms of family households with children, the demographic groups most similar to Romanians are Mongolian (27.6%, a difference of 0.0%), Indian (Asian) (27.6%, a difference of 0.020%), Subsaharan African (27.6%, a difference of 0.080%), Alaskan Athabascan (27.6%, a difference of 0.090%), and Immigrants from Bangladesh (27.6%, a difference of 0.10%).
| Demographics | Rating | Rank | Family Households with Children |
| Portuguese | 77.8 /100 | #151 | Good 27.6% |
| Ethiopians | 77.0 /100 | #152 | Good 27.6% |
| Immigrants | Cabo Verde | 75.6 /100 | #153 | Good 27.6% |
| Icelanders | 75.3 /100 | #154 | Good 27.6% |
| Comanche | 74.8 /100 | #155 | Good 27.6% |
| Hungarians | 74.6 /100 | #156 | Good 27.6% |
| Indians (Asian) | 71.6 /100 | #157 | Good 27.6% |
| Romanians | 70.8 /100 | #158 | Good 27.6% |
| Mongolians | 70.7 /100 | #159 | Good 27.6% |
| Sub-Saharan Africans | 67.5 /100 | #160 | Good 27.6% |
| Alaskan Athabascans | 67.1 /100 | #161 | Good 27.6% |
| Immigrants | Bangladesh | 67.0 /100 | #162 | Good 27.6% |
| Czechs | 65.3 /100 | #163 | Good 27.5% |
| Immigrants | Hong Kong | 64.9 /100 | #164 | Good 27.5% |
| Immigrants | South Africa | 61.3 /100 | #165 | Good 27.5% |