Immigrants from El Salvador vs Nigerian 1st Grade
COMPARE
Immigrants from El Salvador
Nigerian
1st Grade
1st Grade Comparison
Immigrants from El Salvador
Nigerians
96.1%
1ST GRADE
0.0/ 100
METRIC RATING
345th/ 347
METRIC RANK
97.6%
1ST GRADE
1.8/ 100
METRIC RATING
238th/ 347
METRIC RANK
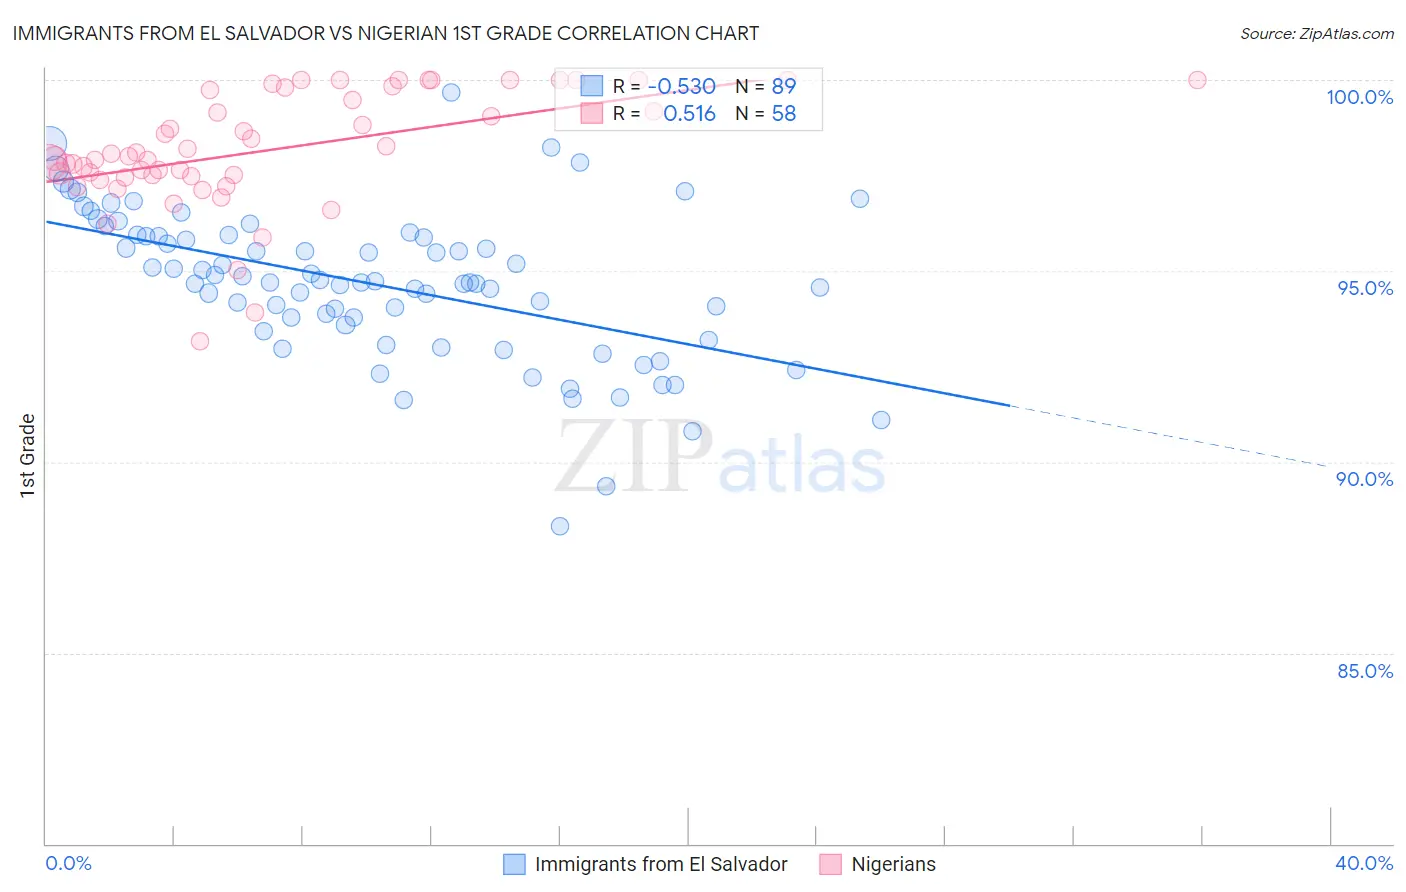
Immigrants from El Salvador vs Nigerian 1st Grade Correlation Chart
The statistical analysis conducted on geographies consisting of 357,698,489 people shows a substantial negative correlation between the proportion of Immigrants from El Salvador and percentage of population with at least 1st grade education in the United States with a correlation coefficient (R) of -0.530 and weighted average of 96.1%. Similarly, the statistical analysis conducted on geographies consisting of 332,724,627 people shows a substantial positive correlation between the proportion of Nigerians and percentage of population with at least 1st grade education in the United States with a correlation coefficient (R) of 0.516 and weighted average of 97.6%, a difference of 1.6%.
1st Grade Correlation Summary
| Measurement | Immigrants from El Salvador | Nigerian |
| Minimum | 88.3% | 93.1% |
| Maximum | 99.7% | 100.0% |
| Range | 11.4% | 6.9% |
| Mean | 94.7% | 98.2% |
| Median | 94.7% | 98.0% |
| Interquartile 25% (IQ1) | 93.5% | 97.5% |
| Interquartile 75% (IQ3) | 95.9% | 99.7% |
| Interquartile Range (IQR) | 2.4% | 2.3% |
| Standard Deviation (Sample) | 2.0% | 1.5% |
| Standard Deviation (Population) | 2.0% | 1.5% |
Similar Demographics by 1st Grade
Demographics Similar to Immigrants from El Salvador by 1st Grade
In terms of 1st grade, the demographic groups most similar to Immigrants from El Salvador are Nepalese (96.1%, a difference of 0.030%), Salvadoran (96.3%, a difference of 0.16%), Immigrants from Mexico (96.3%, a difference of 0.19%), Immigrants from Central America (96.3%, a difference of 0.22%), and Immigrants from Cabo Verde (96.3%, a difference of 0.24%).
| Demographics | Rating | Rank | 1st Grade |
| Immigrants | Dominican Republic | 0.0 /100 | #333 | Tragic 96.5% |
| Bangladeshis | 0.0 /100 | #334 | Tragic 96.5% |
| Yakama | 0.0 /100 | #335 | Tragic 96.5% |
| Guatemalans | 0.0 /100 | #336 | Tragic 96.5% |
| Immigrants | Cambodia | 0.0 /100 | #337 | Tragic 96.5% |
| Immigrants | Fiji | 0.0 /100 | #338 | Tragic 96.4% |
| Immigrants | Guatemala | 0.0 /100 | #339 | Tragic 96.4% |
| Immigrants | Cabo Verde | 0.0 /100 | #340 | Tragic 96.3% |
| Immigrants | Central America | 0.0 /100 | #341 | Tragic 96.3% |
| Immigrants | Mexico | 0.0 /100 | #342 | Tragic 96.3% |
| Salvadorans | 0.0 /100 | #343 | Tragic 96.3% |
| Nepalese | 0.0 /100 | #344 | Tragic 96.1% |
| Immigrants | El Salvador | 0.0 /100 | #345 | Tragic 96.1% |
| Immigrants | Yemen | 0.0 /100 | #346 | Tragic 95.8% |
| Spanish American Indians | 0.0 /100 | #347 | Tragic 95.7% |
Demographics Similar to Nigerians by 1st Grade
In terms of 1st grade, the demographic groups most similar to Nigerians are U.S. Virgin Islander (97.6%, a difference of 0.0%), Colombian (97.6%, a difference of 0.010%), Immigrants from Malaysia (97.6%, a difference of 0.010%), Immigrants from Western Asia (97.6%, a difference of 0.010%), and Immigrants from Eastern Asia (97.6%, a difference of 0.010%).
| Demographics | Rating | Rank | 1st Grade |
| Puerto Ricans | 3.0 /100 | #231 | Tragic 97.7% |
| Immigrants | Uruguay | 2.5 /100 | #232 | Tragic 97.6% |
| Immigrants | Pakistan | 2.2 /100 | #233 | Tragic 97.6% |
| Colombians | 2.2 /100 | #234 | Tragic 97.6% |
| Immigrants | Malaysia | 2.1 /100 | #235 | Tragic 97.6% |
| Immigrants | Western Asia | 2.1 /100 | #236 | Tragic 97.6% |
| U.S. Virgin Islanders | 1.9 /100 | #237 | Tragic 97.6% |
| Nigerians | 1.8 /100 | #238 | Tragic 97.6% |
| Immigrants | Eastern Asia | 1.6 /100 | #239 | Tragic 97.6% |
| Koreans | 1.5 /100 | #240 | Tragic 97.6% |
| Liberians | 1.4 /100 | #241 | Tragic 97.6% |
| Immigrants | Indonesia | 1.2 /100 | #242 | Tragic 97.6% |
| Bolivians | 1.2 /100 | #243 | Tragic 97.6% |
| Asians | 1.1 /100 | #244 | Tragic 97.6% |
| South Americans | 1.1 /100 | #245 | Tragic 97.6% |