Immigrants from El Salvador vs Arab 12th Grade, No Diploma
COMPARE
Immigrants from El Salvador
Arab
12th Grade, No Diploma
12th Grade, No Diploma Comparison
Immigrants from El Salvador
Arabs
83.6%
12TH GRADE, NO DIPLOMA
0.0/ 100
METRIC RATING
343rd/ 347
METRIC RANK
91.6%
12TH GRADE, NO DIPLOMA
84.1/ 100
METRIC RATING
138th/ 347
METRIC RANK
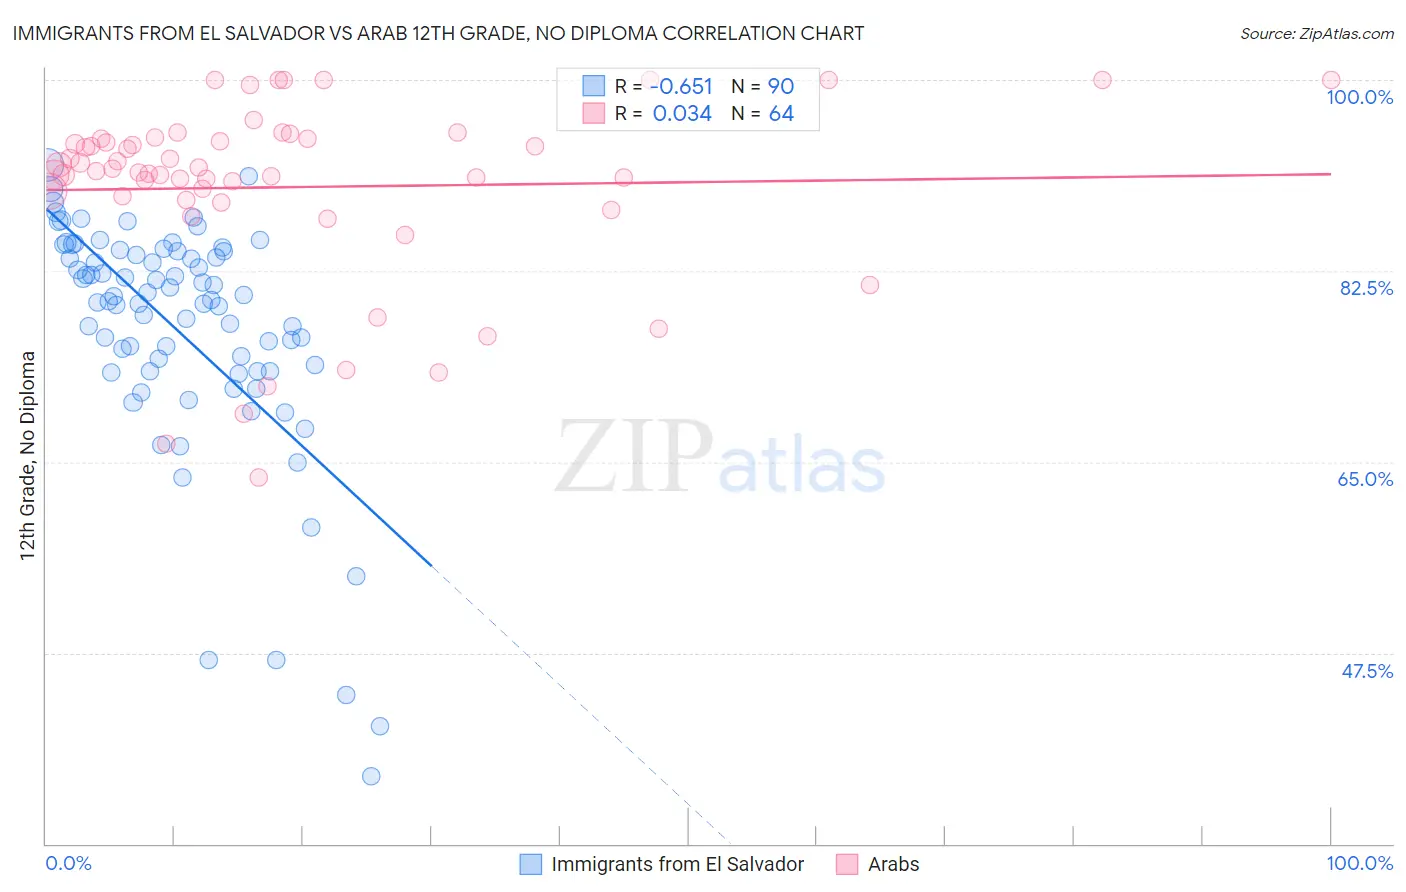
Immigrants from El Salvador vs Arab 12th Grade, No Diploma Correlation Chart
The statistical analysis conducted on geographies consisting of 357,852,938 people shows a significant negative correlation between the proportion of Immigrants from El Salvador and percentage of population with at least 12th grade (no diploma) education in the United States with a correlation coefficient (R) of -0.651 and weighted average of 83.6%. Similarly, the statistical analysis conducted on geographies consisting of 486,870,847 people shows no correlation between the proportion of Arabs and percentage of population with at least 12th grade (no diploma) education in the United States with a correlation coefficient (R) of 0.034 and weighted average of 91.6%, a difference of 9.6%.
12th Grade, No Diploma Correlation Summary
| Measurement | Immigrants from El Salvador | Arab |
| Minimum | 36.2% | 63.5% |
| Maximum | 92.2% | 100.0% |
| Range | 56.0% | 36.5% |
| Mean | 77.1% | 90.2% |
| Median | 79.8% | 91.8% |
| Interquartile 25% (IQ1) | 73.3% | 89.2% |
| Interquartile 75% (IQ3) | 84.3% | 94.6% |
| Interquartile Range (IQR) | 11.0% | 5.4% |
| Standard Deviation (Sample) | 10.9% | 8.4% |
| Standard Deviation (Population) | 10.9% | 8.3% |
Similar Demographics by 12th Grade, No Diploma
Demographics Similar to Immigrants from El Salvador by 12th Grade, No Diploma
In terms of 12th grade, no diploma, the demographic groups most similar to Immigrants from El Salvador are Houma (83.7%, a difference of 0.16%), Immigrants from Guatemala (84.0%, a difference of 0.51%), Mexican (84.1%, a difference of 0.65%), Immigrants from Central America (83.0%, a difference of 0.74%), and Spanish American Indian (82.9%, a difference of 0.80%).
| Demographics | Rating | Rank | 12th Grade, No Diploma |
| Immigrants | Latin America | 0.0 /100 | #333 | Tragic 85.0% |
| Immigrants | Dominican Republic | 0.0 /100 | #334 | Tragic 84.9% |
| Immigrants | Yemen | 0.0 /100 | #335 | Tragic 84.8% |
| Tohono O'odham | 0.0 /100 | #336 | Tragic 84.7% |
| Pima | 0.0 /100 | #337 | Tragic 84.6% |
| Guatemalans | 0.0 /100 | #338 | Tragic 84.6% |
| Salvadorans | 0.0 /100 | #339 | Tragic 84.5% |
| Mexicans | 0.0 /100 | #340 | Tragic 84.1% |
| Immigrants | Guatemala | 0.0 /100 | #341 | Tragic 84.0% |
| Houma | 0.0 /100 | #342 | Tragic 83.7% |
| Immigrants | El Salvador | 0.0 /100 | #343 | Tragic 83.6% |
| Immigrants | Central America | 0.0 /100 | #344 | Tragic 83.0% |
| Spanish American Indians | 0.0 /100 | #345 | Tragic 82.9% |
| Yakama | 0.0 /100 | #346 | Tragic 82.5% |
| Immigrants | Mexico | 0.0 /100 | #347 | Tragic 82.4% |
Demographics Similar to Arabs by 12th Grade, No Diploma
In terms of 12th grade, no diploma, the demographic groups most similar to Arabs are Immigrants from Egypt (91.6%, a difference of 0.0%), Alaska Native (91.6%, a difference of 0.020%), Chilean (91.7%, a difference of 0.040%), Immigrants from Poland (91.6%, a difference of 0.040%), and Argentinean (91.6%, a difference of 0.050%).
| Demographics | Rating | Rank | 12th Grade, No Diploma |
| Albanians | 89.3 /100 | #131 | Excellent 91.8% |
| Immigrants | Eastern Asia | 89.3 /100 | #132 | Excellent 91.8% |
| Immigrants | Italy | 88.3 /100 | #133 | Excellent 91.7% |
| Venezuelans | 88.2 /100 | #134 | Excellent 91.7% |
| Immigrants | Bosnia and Herzegovina | 87.3 /100 | #135 | Excellent 91.7% |
| Chileans | 85.8 /100 | #136 | Excellent 91.7% |
| Alaska Natives | 84.9 /100 | #137 | Excellent 91.6% |
| Arabs | 84.1 /100 | #138 | Excellent 91.6% |
| Immigrants | Egypt | 83.9 /100 | #139 | Excellent 91.6% |
| Immigrants | Poland | 82.3 /100 | #140 | Excellent 91.6% |
| Argentineans | 82.0 /100 | #141 | Excellent 91.6% |
| Immigrants | Venezuela | 80.9 /100 | #142 | Excellent 91.6% |
| Immigrants | Argentina | 80.7 /100 | #143 | Excellent 91.6% |
| Immigrants | Spain | 80.1 /100 | #144 | Excellent 91.6% |
| Immigrants | Lebanon | 80.0 /100 | #145 | Excellent 91.6% |