Immigrants from Dominica vs Salvadoran Single Mother Households
COMPARE
Immigrants from Dominica
Salvadoran
Single Mother Households
Single Mother Households Comparison
Immigrants from Dominica
Salvadorans
8.7%
SINGLE MOTHER HOUSEHOLDS
0.0/ 100
METRIC RATING
335th/ 347
METRIC RANK
7.5%
SINGLE MOTHER HOUSEHOLDS
0.1/ 100
METRIC RATING
271st/ 347
METRIC RANK
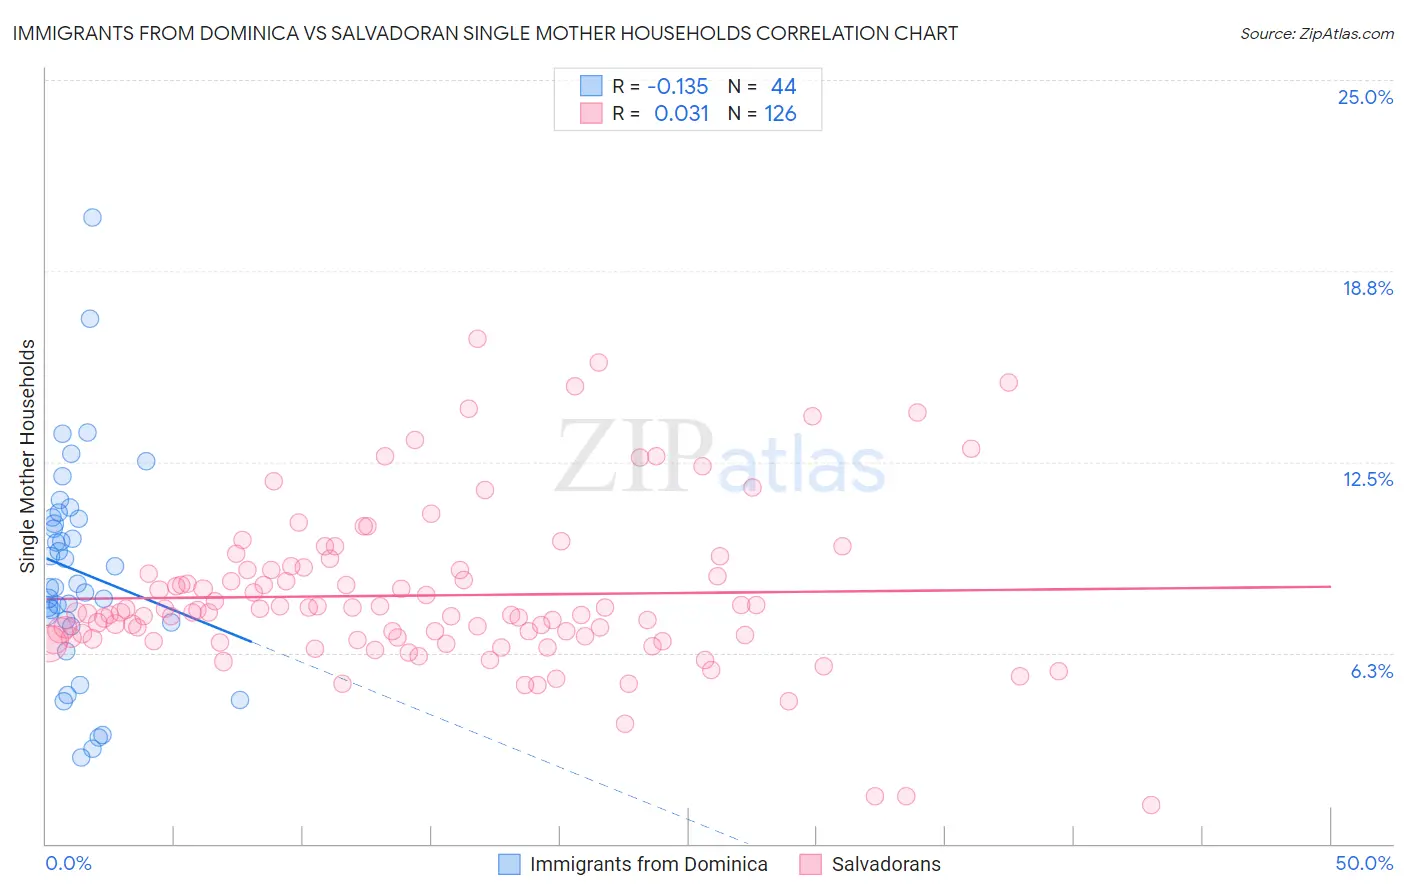
Immigrants from Dominica vs Salvadoran Single Mother Households Correlation Chart
The statistical analysis conducted on geographies consisting of 83,777,287 people shows a poor negative correlation between the proportion of Immigrants from Dominica and percentage of single mother households in the United States with a correlation coefficient (R) of -0.135 and weighted average of 8.7%. Similarly, the statistical analysis conducted on geographies consisting of 398,116,409 people shows no correlation between the proportion of Salvadorans and percentage of single mother households in the United States with a correlation coefficient (R) of 0.031 and weighted average of 7.5%, a difference of 16.0%.
Single Mother Households Correlation Summary
| Measurement | Immigrants from Dominica | Salvadoran |
| Minimum | 2.8% | 1.3% |
| Maximum | 20.5% | 16.5% |
| Range | 17.7% | 15.3% |
| Mean | 8.9% | 8.1% |
| Median | 8.5% | 7.6% |
| Interquartile 25% (IQ1) | 7.3% | 6.7% |
| Interquartile 75% (IQ3) | 10.7% | 9.0% |
| Interquartile Range (IQR) | 3.4% | 2.3% |
| Standard Deviation (Sample) | 3.5% | 2.6% |
| Standard Deviation (Population) | 3.5% | 2.6% |
Similar Demographics by Single Mother Households
Demographics Similar to Immigrants from Dominica by Single Mother Households
In terms of single mother households, the demographic groups most similar to Immigrants from Dominica are Puerto Rican (8.7%, a difference of 0.040%), Immigrants from Liberia (8.7%, a difference of 0.29%), Liberian (8.6%, a difference of 1.1%), Navajo (8.8%, a difference of 1.2%), and Cape Verdean (8.9%, a difference of 1.3%).
| Demographics | Rating | Rank | Single Mother Households |
| Yakama | 0.0 /100 | #328 | Tragic 8.4% |
| Hopi | 0.0 /100 | #329 | Tragic 8.5% |
| Inupiat | 0.0 /100 | #330 | Tragic 8.5% |
| Sioux | 0.0 /100 | #331 | Tragic 8.5% |
| U.S. Virgin Islanders | 0.0 /100 | #332 | Tragic 8.6% |
| Liberians | 0.0 /100 | #333 | Tragic 8.6% |
| Immigrants | Liberia | 0.0 /100 | #334 | Tragic 8.7% |
| Immigrants | Dominica | 0.0 /100 | #335 | Tragic 8.7% |
| Puerto Ricans | 0.0 /100 | #336 | Tragic 8.7% |
| Navajo | 0.0 /100 | #337 | Tragic 8.8% |
| Cape Verdeans | 0.0 /100 | #338 | Tragic 8.9% |
| Blacks/African Americans | 0.0 /100 | #339 | Tragic 9.0% |
| Lumbee | 0.0 /100 | #340 | Tragic 9.1% |
| Tohono O'odham | 0.0 /100 | #341 | Tragic 9.1% |
| Menominee | 0.0 /100 | #342 | Tragic 9.2% |
Demographics Similar to Salvadorans by Single Mother Households
In terms of single mother households, the demographic groups most similar to Salvadorans are Immigrants from the Azores (7.5%, a difference of 0.0%), Immigrants from Cuba (7.5%, a difference of 0.090%), Somali (7.5%, a difference of 0.25%), Belizean (7.6%, a difference of 0.32%), and Immigrants from Guyana (7.6%, a difference of 0.36%).
| Demographics | Rating | Rank | Single Mother Households |
| Yaqui | 0.1 /100 | #264 | Tragic 7.4% |
| Crow | 0.1 /100 | #265 | Tragic 7.4% |
| Nepalese | 0.1 /100 | #266 | Tragic 7.5% |
| Blackfeet | 0.1 /100 | #267 | Tragic 7.5% |
| Indonesians | 0.1 /100 | #268 | Tragic 7.5% |
| Somalis | 0.1 /100 | #269 | Tragic 7.5% |
| Immigrants | Cuba | 0.1 /100 | #270 | Tragic 7.5% |
| Salvadorans | 0.1 /100 | #271 | Tragic 7.5% |
| Immigrants | Azores | 0.1 /100 | #272 | Tragic 7.5% |
| Belizeans | 0.1 /100 | #273 | Tragic 7.6% |
| Immigrants | Guyana | 0.1 /100 | #274 | Tragic 7.6% |
| Central American Indians | 0.1 /100 | #275 | Tragic 7.6% |
| Guyanese | 0.1 /100 | #276 | Tragic 7.6% |
| Immigrants | Trinidad and Tobago | 0.1 /100 | #277 | Tragic 7.6% |
| Central Americans | 0.1 /100 | #278 | Tragic 7.6% |