Immigrants from Northern Africa vs Immigrants from Hong Kong Single Mother Households
COMPARE
Immigrants from Northern Africa
Immigrants from Hong Kong
Single Mother Households
Single Mother Households Comparison
Immigrants from Northern Africa
Immigrants from Hong Kong
6.2%
SINGLE MOTHER HOUSEHOLDS
68.0/ 100
METRIC RATING
164th/ 347
METRIC RANK
4.8%
SINGLE MOTHER HOUSEHOLDS
100.0/ 100
METRIC RATING
5th/ 347
METRIC RANK
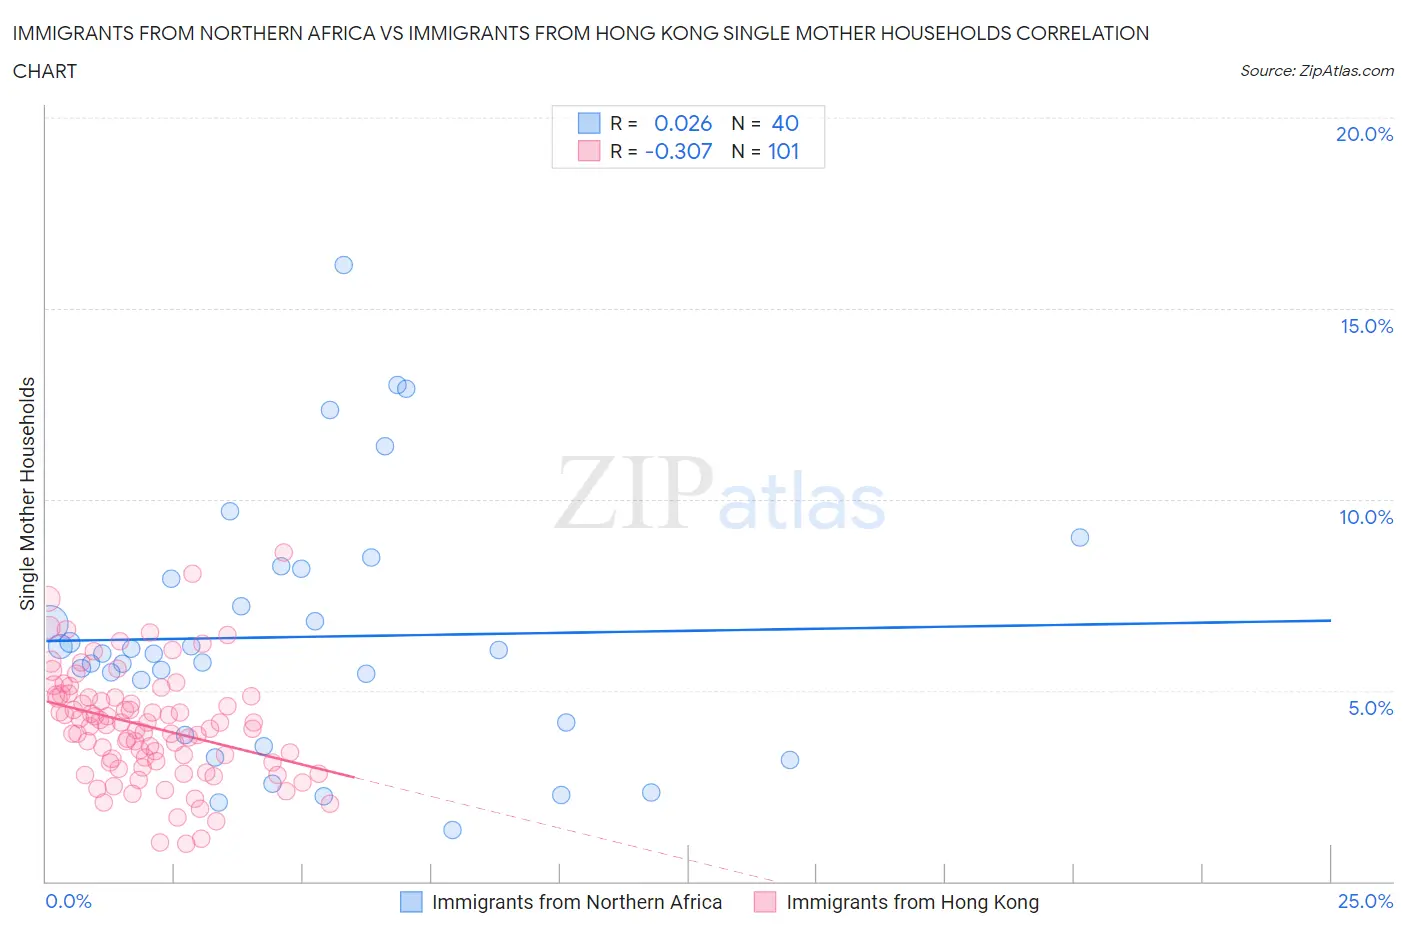
Immigrants from Northern Africa vs Immigrants from Hong Kong Single Mother Households Correlation Chart
The statistical analysis conducted on geographies consisting of 320,525,361 people shows no correlation between the proportion of Immigrants from Northern Africa and percentage of single mother households in the United States with a correlation coefficient (R) of 0.026 and weighted average of 6.2%. Similarly, the statistical analysis conducted on geographies consisting of 253,414,911 people shows a mild negative correlation between the proportion of Immigrants from Hong Kong and percentage of single mother households in the United States with a correlation coefficient (R) of -0.307 and weighted average of 4.8%, a difference of 27.8%.
Single Mother Households Correlation Summary
| Measurement | Immigrants from Northern Africa | Immigrants from Hong Kong |
| Minimum | 1.3% | 0.98% |
| Maximum | 16.1% | 8.6% |
| Range | 14.8% | 7.6% |
| Mean | 6.4% | 4.1% |
| Median | 6.0% | 4.1% |
| Interquartile 25% (IQ1) | 4.0% | 3.1% |
| Interquartile 75% (IQ3) | 8.0% | 4.8% |
| Interquartile Range (IQR) | 4.0% | 1.7% |
| Standard Deviation (Sample) | 3.3% | 1.4% |
| Standard Deviation (Population) | 3.3% | 1.4% |
Similar Demographics by Single Mother Households
Demographics Similar to Immigrants from Northern Africa by Single Mother Households
In terms of single mother households, the demographic groups most similar to Immigrants from Northern Africa are Immigrants from Syria (6.2%, a difference of 0.070%), Alsatian (6.2%, a difference of 0.090%), Immigrants from Zimbabwe (6.2%, a difference of 0.25%), Sri Lankan (6.2%, a difference of 0.50%), and Immigrants from Germany (6.1%, a difference of 0.60%).
| Demographics | Rating | Rank | Single Mother Households |
| Chileans | 74.2 /100 | #157 | Good 6.1% |
| Celtics | 73.3 /100 | #158 | Good 6.1% |
| Yugoslavians | 73.1 /100 | #159 | Good 6.1% |
| Iraqis | 73.0 /100 | #160 | Good 6.1% |
| Immigrants | Germany | 72.4 /100 | #161 | Good 6.1% |
| Immigrants | Zimbabwe | 69.9 /100 | #162 | Good 6.2% |
| Alsatians | 68.7 /100 | #163 | Good 6.2% |
| Immigrants | Northern Africa | 68.0 /100 | #164 | Good 6.2% |
| Immigrants | Syria | 67.4 /100 | #165 | Good 6.2% |
| Sri Lankans | 63.9 /100 | #166 | Good 6.2% |
| Brazilians | 59.1 /100 | #167 | Average 6.2% |
| Immigrants | Chile | 58.3 /100 | #168 | Average 6.3% |
| Puget Sound Salish | 58.1 /100 | #169 | Average 6.3% |
| Immigrants | Oceania | 54.6 /100 | #170 | Average 6.3% |
| Afghans | 52.5 /100 | #171 | Average 6.3% |
Demographics Similar to Immigrants from Hong Kong by Single Mother Households
In terms of single mother households, the demographic groups most similar to Immigrants from Hong Kong are Assyrian/Chaldean/Syriac (4.8%, a difference of 0.52%), Immigrants from Iran (4.8%, a difference of 0.60%), Immigrants from Singapore (5.0%, a difference of 2.6%), Iranian (5.0%, a difference of 2.8%), and Filipino (4.7%, a difference of 3.0%).
| Demographics | Rating | Rank | Single Mother Households |
| Immigrants | Taiwan | 100.0 /100 | #1 | Exceptional 4.7% |
| Filipinos | 100.0 /100 | #2 | Exceptional 4.7% |
| Immigrants | Iran | 100.0 /100 | #3 | Exceptional 4.8% |
| Assyrians/Chaldeans/Syriacs | 100.0 /100 | #4 | Exceptional 4.8% |
| Immigrants | Hong Kong | 100.0 /100 | #5 | Exceptional 4.8% |
| Immigrants | Singapore | 100.0 /100 | #6 | Exceptional 5.0% |
| Iranians | 100.0 /100 | #7 | Exceptional 5.0% |
| Immigrants | Ireland | 99.9 /100 | #8 | Exceptional 5.0% |
| Okinawans | 99.9 /100 | #9 | Exceptional 5.0% |
| Immigrants | Israel | 99.9 /100 | #10 | Exceptional 5.0% |
| Immigrants | China | 99.9 /100 | #11 | Exceptional 5.1% |
| Cypriots | 99.9 /100 | #12 | Exceptional 5.1% |
| Immigrants | India | 99.9 /100 | #13 | Exceptional 5.1% |
| Immigrants | Australia | 99.9 /100 | #14 | Exceptional 5.1% |
| Immigrants | Eastern Asia | 99.9 /100 | #15 | Exceptional 5.1% |