Immigrants from Denmark vs South American Indian Divorced or Separated
COMPARE
Immigrants from Denmark
South American Indian
Divorced or Separated
Divorced or Separated Comparison
Immigrants from Denmark
South American Indians
11.6%
DIVORCED OR SEPARATED
98.9/ 100
METRIC RATING
92nd/ 347
METRIC RANK
11.8%
DIVORCED OR SEPARATED
92.1/ 100
METRIC RATING
126th/ 347
METRIC RANK
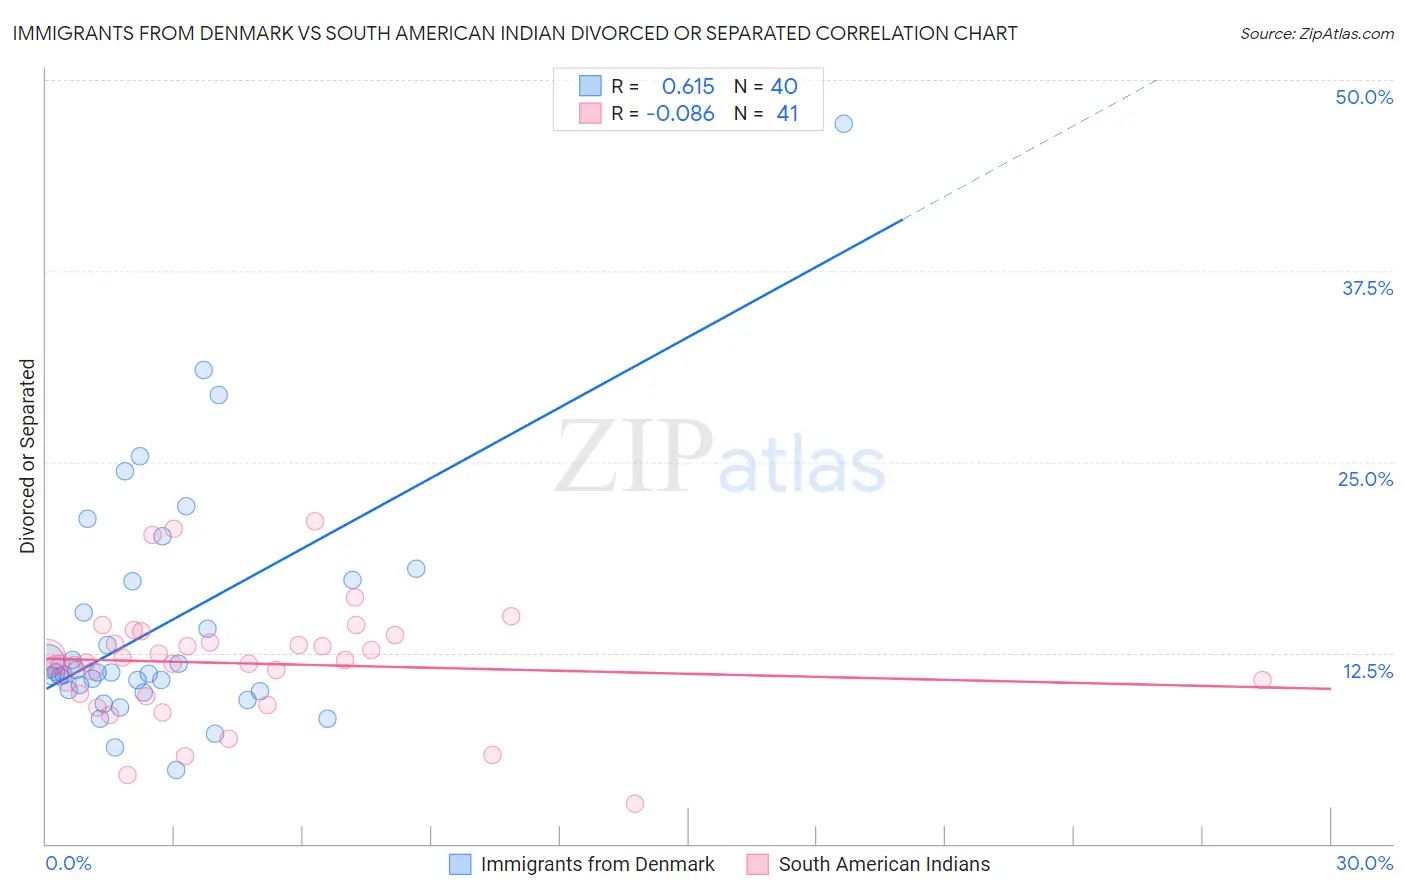
Immigrants from Denmark vs South American Indian Divorced or Separated Correlation Chart
The statistical analysis conducted on geographies consisting of 136,412,843 people shows a significant positive correlation between the proportion of Immigrants from Denmark and percentage of population currently divorced or separated in the United States with a correlation coefficient (R) of 0.615 and weighted average of 11.6%. Similarly, the statistical analysis conducted on geographies consisting of 164,560,857 people shows a slight negative correlation between the proportion of South American Indians and percentage of population currently divorced or separated in the United States with a correlation coefficient (R) of -0.086 and weighted average of 11.8%, a difference of 1.8%.
Divorced or Separated Correlation Summary
| Measurement | Immigrants from Denmark | South American Indian |
| Minimum | 4.8% | 2.6% |
| Maximum | 47.1% | 21.1% |
| Range | 42.3% | 18.5% |
| Mean | 14.4% | 11.8% |
| Median | 11.2% | 11.9% |
| Interquartile 25% (IQ1) | 10.0% | 9.7% |
| Interquartile 75% (IQ3) | 17.2% | 13.4% |
| Interquartile Range (IQR) | 7.2% | 3.7% |
| Standard Deviation (Sample) | 8.1% | 3.8% |
| Standard Deviation (Population) | 8.0% | 3.8% |
Similar Demographics by Divorced or Separated
Demographics Similar to Immigrants from Denmark by Divorced or Separated
In terms of divorced or separated, the demographic groups most similar to Immigrants from Denmark are Arab (11.6%, a difference of 0.0%), Immigrants from Fiji (11.6%, a difference of 0.010%), Spanish American Indian (11.6%, a difference of 0.060%), Zimbabwean (11.6%, a difference of 0.10%), and Immigrants from Serbia (11.6%, a difference of 0.11%).
| Demographics | Rating | Rank | Divorced or Separated |
| Immigrants | Albania | 99.3 /100 | #85 | Exceptional 11.5% |
| Immigrants | Latvia | 99.2 /100 | #86 | Exceptional 11.6% |
| Immigrants | Nepal | 99.2 /100 | #87 | Exceptional 11.6% |
| Immigrants | Europe | 99.2 /100 | #88 | Exceptional 11.6% |
| Immigrants | Southern Europe | 99.1 /100 | #89 | Exceptional 11.6% |
| Zimbabweans | 99.0 /100 | #90 | Exceptional 11.6% |
| Spanish American Indians | 99.0 /100 | #91 | Exceptional 11.6% |
| Immigrants | Denmark | 98.9 /100 | #92 | Exceptional 11.6% |
| Arabs | 98.9 /100 | #93 | Exceptional 11.6% |
| Immigrants | Fiji | 98.9 /100 | #94 | Exceptional 11.6% |
| Immigrants | Serbia | 98.8 /100 | #95 | Exceptional 11.6% |
| Immigrants | Ukraine | 98.7 /100 | #96 | Exceptional 11.6% |
| Latvians | 98.7 /100 | #97 | Exceptional 11.6% |
| Immigrants | Jordan | 98.6 /100 | #98 | Exceptional 11.6% |
| Immigrants | Sweden | 98.6 /100 | #99 | Exceptional 11.6% |
Demographics Similar to South American Indians by Divorced or Separated
In terms of divorced or separated, the demographic groups most similar to South American Indians are Ukrainian (11.8%, a difference of 0.020%), Ugandan (11.8%, a difference of 0.13%), Immigrants (11.8%, a difference of 0.21%), Menominee (11.8%, a difference of 0.22%), and Romanian (11.8%, a difference of 0.34%).
| Demographics | Rating | Rank | Divorced or Separated |
| Syrians | 95.1 /100 | #119 | Exceptional 11.7% |
| Iraqis | 94.6 /100 | #120 | Exceptional 11.8% |
| Romanians | 94.5 /100 | #121 | Exceptional 11.8% |
| Menominee | 93.8 /100 | #122 | Exceptional 11.8% |
| Immigrants | Immigrants | 93.7 /100 | #123 | Exceptional 11.8% |
| Ugandans | 93.1 /100 | #124 | Exceptional 11.8% |
| Ukrainians | 92.3 /100 | #125 | Exceptional 11.8% |
| South American Indians | 92.1 /100 | #126 | Exceptional 11.8% |
| South Africans | 88.9 /100 | #127 | Excellent 11.8% |
| Immigrants | Ecuador | 88.9 /100 | #128 | Excellent 11.8% |
| Immigrants | St. Vincent and the Grenadines | 88.4 /100 | #129 | Excellent 11.8% |
| Immigrants | Austria | 88.2 /100 | #130 | Excellent 11.8% |
| Immigrants | Cambodia | 88.2 /100 | #131 | Excellent 11.8% |
| Immigrants | Afghanistan | 87.9 /100 | #132 | Excellent 11.8% |
| New Zealanders | 87.5 /100 | #133 | Excellent 11.9% |