Immigrants from Czechoslovakia vs Panamanian Family Households with Children
COMPARE
Immigrants from Czechoslovakia
Panamanian
Family Households with Children
Family Households with Children Comparison
Immigrants from Czechoslovakia
Panamanians
26.2%
FAMILY HOUSEHOLDS WITH CHILDREN
0.0/ 100
METRIC RATING
312th/ 347
METRIC RANK
28.2%
FAMILY HOUSEHOLDS WITH CHILDREN
99.3/ 100
METRIC RATING
93rd/ 347
METRIC RANK
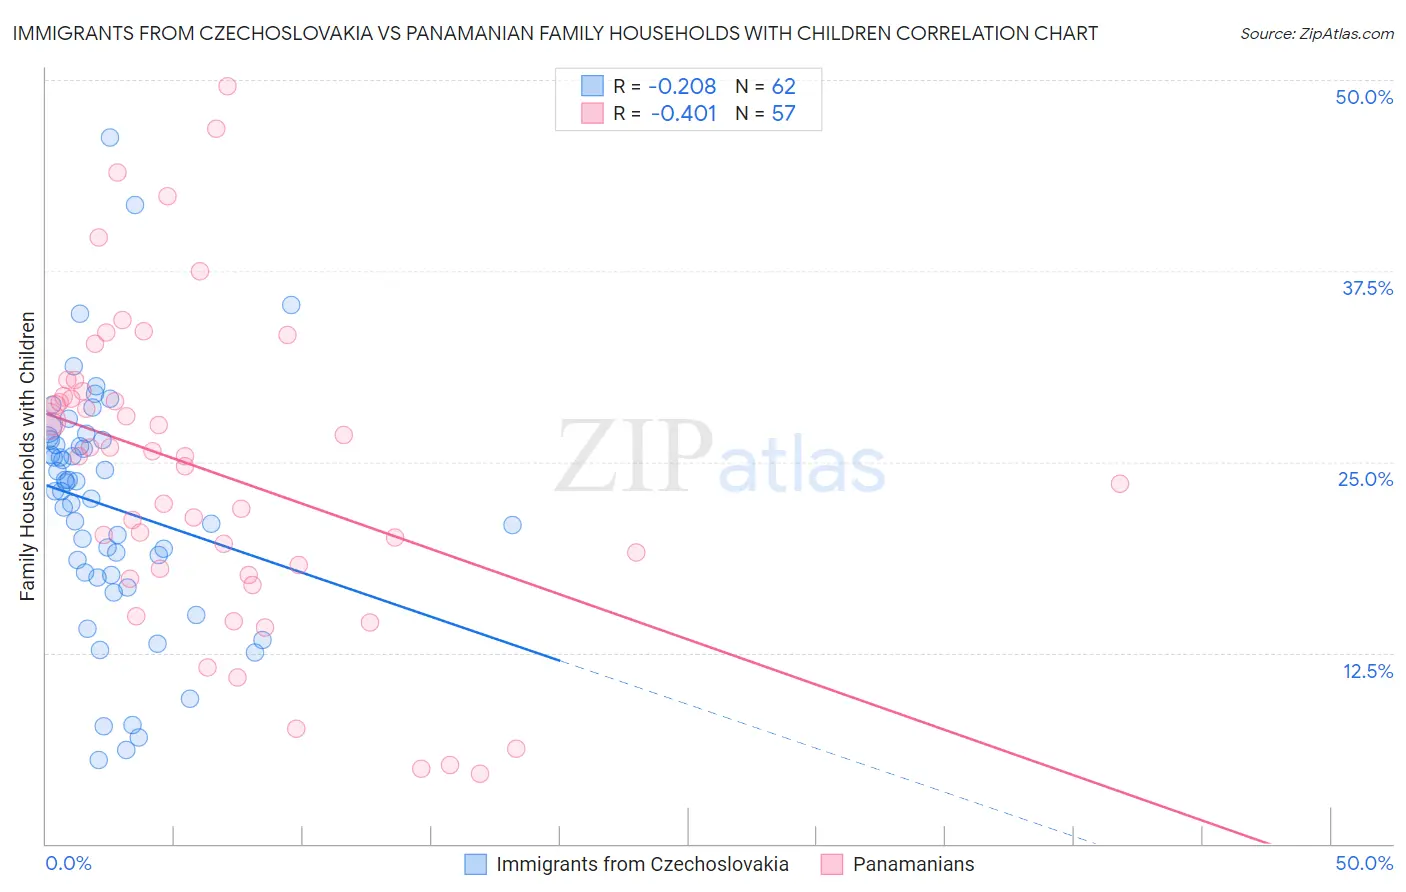
Immigrants from Czechoslovakia vs Panamanian Family Households with Children Correlation Chart
The statistical analysis conducted on geographies consisting of 195,398,985 people shows a weak negative correlation between the proportion of Immigrants from Czechoslovakia and percentage of family households with children in the United States with a correlation coefficient (R) of -0.208 and weighted average of 26.2%. Similarly, the statistical analysis conducted on geographies consisting of 281,035,493 people shows a moderate negative correlation between the proportion of Panamanians and percentage of family households with children in the United States with a correlation coefficient (R) of -0.401 and weighted average of 28.2%, a difference of 7.5%.
Family Households with Children Correlation Summary
| Measurement | Immigrants from Czechoslovakia | Panamanian |
| Minimum | 5.5% | 4.6% |
| Maximum | 46.3% | 49.6% |
| Range | 40.8% | 45.0% |
| Mean | 22.0% | 24.4% |
| Median | 23.1% | 25.4% |
| Interquartile 25% (IQ1) | 17.6% | 17.8% |
| Interquartile 75% (IQ3) | 26.4% | 29.4% |
| Interquartile Range (IQR) | 8.8% | 11.7% |
| Standard Deviation (Sample) | 8.0% | 10.2% |
| Standard Deviation (Population) | 7.9% | 10.1% |
Similar Demographics by Family Households with Children
Demographics Similar to Immigrants from Czechoslovakia by Family Households with Children
In terms of family households with children, the demographic groups most similar to Immigrants from Czechoslovakia are Colville (26.2%, a difference of 0.070%), Marshallese (26.2%, a difference of 0.12%), Immigrants from Somalia (26.3%, a difference of 0.16%), Cree (26.2%, a difference of 0.26%), and Lumbee (26.3%, a difference of 0.27%).
| Demographics | Rating | Rank | Family Households with Children |
| Guyanese | 0.1 /100 | #305 | Tragic 26.3% |
| Bermudans | 0.1 /100 | #306 | Tragic 26.3% |
| West Indians | 0.0 /100 | #307 | Tragic 26.3% |
| Lumbee | 0.0 /100 | #308 | Tragic 26.3% |
| Immigrants | Somalia | 0.0 /100 | #309 | Tragic 26.3% |
| Marshallese | 0.0 /100 | #310 | Tragic 26.2% |
| Colville | 0.0 /100 | #311 | Tragic 26.2% |
| Immigrants | Czechoslovakia | 0.0 /100 | #312 | Tragic 26.2% |
| Cree | 0.0 /100 | #313 | Tragic 26.2% |
| French Canadians | 0.0 /100 | #314 | Tragic 26.1% |
| Immigrants | Norway | 0.0 /100 | #315 | Tragic 26.1% |
| Estonians | 0.0 /100 | #316 | Tragic 26.1% |
| Ottawa | 0.0 /100 | #317 | Tragic 26.1% |
| Iroquois | 0.0 /100 | #318 | Tragic 26.1% |
| Immigrants | France | 0.0 /100 | #319 | Tragic 26.0% |
Demographics Similar to Panamanians by Family Households with Children
In terms of family households with children, the demographic groups most similar to Panamanians are Immigrants from Colombia (28.2%, a difference of 0.050%), Chickasaw (28.2%, a difference of 0.11%), Immigrants from Nicaragua (28.2%, a difference of 0.11%), Immigrants from Liberia (28.2%, a difference of 0.13%), and Ute (28.2%, a difference of 0.14%).
| Demographics | Rating | Rank | Family Households with Children |
| Immigrants | Western Africa | 99.6 /100 | #86 | Exceptional 28.3% |
| Colombians | 99.6 /100 | #87 | Exceptional 28.3% |
| Liberians | 99.6 /100 | #88 | Exceptional 28.3% |
| Immigrants | Costa Rica | 99.6 /100 | #89 | Exceptional 28.3% |
| Immigrants | Thailand | 99.5 /100 | #90 | Exceptional 28.2% |
| Immigrants | Liberia | 99.4 /100 | #91 | Exceptional 28.2% |
| Chickasaw | 99.4 /100 | #92 | Exceptional 28.2% |
| Panamanians | 99.3 /100 | #93 | Exceptional 28.2% |
| Immigrants | Colombia | 99.2 /100 | #94 | Exceptional 28.2% |
| Immigrants | Nicaragua | 99.1 /100 | #95 | Exceptional 28.2% |
| Ute | 99.1 /100 | #96 | Exceptional 28.2% |
| Chileans | 98.9 /100 | #97 | Exceptional 28.1% |
| Immigrants | Kenya | 98.9 /100 | #98 | Exceptional 28.1% |
| Immigrants | Azores | 98.8 /100 | #99 | Exceptional 28.1% |
| Indonesians | 98.8 /100 | #100 | Exceptional 28.1% |