Immigrants from Czechoslovakia vs Tlingit-Haida Family Households with Children
COMPARE
Immigrants from Czechoslovakia
Tlingit-Haida
Family Households with Children
Family Households with Children Comparison
Immigrants from Czechoslovakia
Tlingit-Haida
26.2%
FAMILY HOUSEHOLDS WITH CHILDREN
0.0/ 100
METRIC RATING
312th/ 347
METRIC RANK
26.0%
FAMILY HOUSEHOLDS WITH CHILDREN
0.0/ 100
METRIC RATING
320th/ 347
METRIC RANK
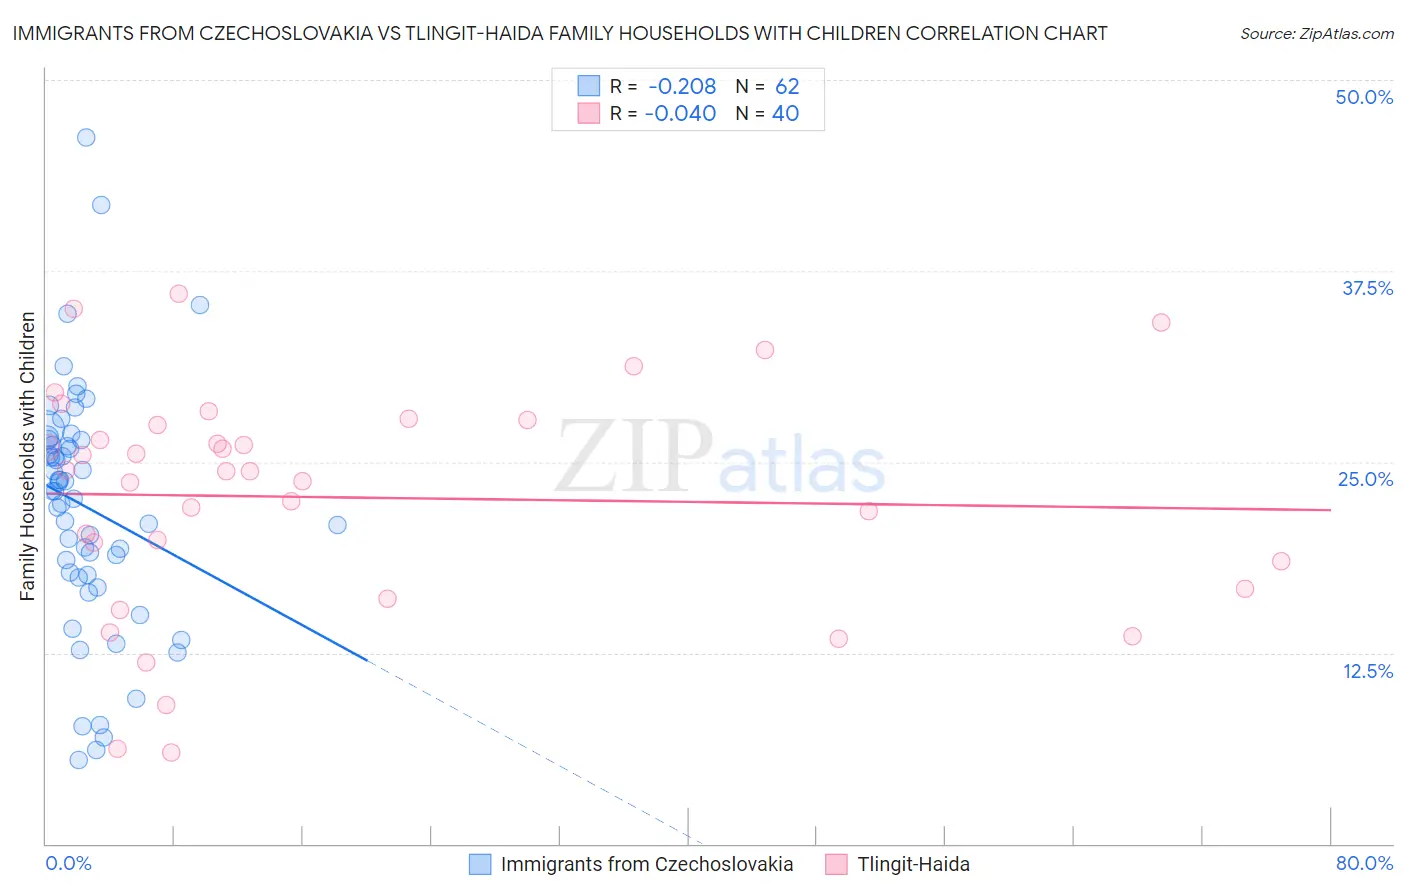
Immigrants from Czechoslovakia vs Tlingit-Haida Family Households with Children Correlation Chart
The statistical analysis conducted on geographies consisting of 195,398,985 people shows a weak negative correlation between the proportion of Immigrants from Czechoslovakia and percentage of family households with children in the United States with a correlation coefficient (R) of -0.208 and weighted average of 26.2%. Similarly, the statistical analysis conducted on geographies consisting of 60,854,309 people shows no correlation between the proportion of Tlingit-Haida and percentage of family households with children in the United States with a correlation coefficient (R) of -0.040 and weighted average of 26.0%, a difference of 0.73%.
Family Households with Children Correlation Summary
| Measurement | Immigrants from Czechoslovakia | Tlingit-Haida |
| Minimum | 5.5% | 6.0% |
| Maximum | 46.3% | 36.0% |
| Range | 40.8% | 30.0% |
| Mean | 22.0% | 22.7% |
| Median | 23.1% | 24.4% |
| Interquartile 25% (IQ1) | 17.6% | 17.6% |
| Interquartile 75% (IQ3) | 26.4% | 27.6% |
| Interquartile Range (IQR) | 8.8% | 10.0% |
| Standard Deviation (Sample) | 8.0% | 7.5% |
| Standard Deviation (Population) | 7.9% | 7.4% |
Demographics Similar to Immigrants from Czechoslovakia and Tlingit-Haida by Family Households with Children
In terms of family households with children, the demographic groups most similar to Immigrants from Czechoslovakia are Colville (26.2%, a difference of 0.070%), Marshallese (26.2%, a difference of 0.12%), Immigrants from Somalia (26.3%, a difference of 0.16%), Cree (26.2%, a difference of 0.26%), and Lumbee (26.3%, a difference of 0.27%). Similarly, the demographic groups most similar to Tlingit-Haida are British West Indian (26.0%, a difference of 0.010%), Immigrants from France (26.0%, a difference of 0.020%), Immigrants from Greece (26.0%, a difference of 0.030%), Immigrants from Australia (26.0%, a difference of 0.060%), and Chinese (26.0%, a difference of 0.090%).
| Demographics | Rating | Rank | Family Households with Children |
| Bermudans | 0.1 /100 | #306 | Tragic 26.3% |
| West Indians | 0.0 /100 | #307 | Tragic 26.3% |
| Lumbee | 0.0 /100 | #308 | Tragic 26.3% |
| Immigrants | Somalia | 0.0 /100 | #309 | Tragic 26.3% |
| Marshallese | 0.0 /100 | #310 | Tragic 26.2% |
| Colville | 0.0 /100 | #311 | Tragic 26.2% |
| Immigrants | Czechoslovakia | 0.0 /100 | #312 | Tragic 26.2% |
| Cree | 0.0 /100 | #313 | Tragic 26.2% |
| French Canadians | 0.0 /100 | #314 | Tragic 26.1% |
| Immigrants | Norway | 0.0 /100 | #315 | Tragic 26.1% |
| Estonians | 0.0 /100 | #316 | Tragic 26.1% |
| Ottawa | 0.0 /100 | #317 | Tragic 26.1% |
| Iroquois | 0.0 /100 | #318 | Tragic 26.1% |
| Immigrants | France | 0.0 /100 | #319 | Tragic 26.0% |
| Tlingit-Haida | 0.0 /100 | #320 | Tragic 26.0% |
| British West Indians | 0.0 /100 | #321 | Tragic 26.0% |
| Immigrants | Greece | 0.0 /100 | #322 | Tragic 26.0% |
| Immigrants | Australia | 0.0 /100 | #323 | Tragic 26.0% |
| Chinese | 0.0 /100 | #324 | Tragic 26.0% |
| Barbadians | 0.0 /100 | #325 | Tragic 26.0% |
| Immigrants | Ireland | 0.0 /100 | #326 | Tragic 26.0% |