Immigrants from Peru vs Panamanian Family Households with Children
COMPARE
Immigrants from Peru
Panamanian
Family Households with Children
Family Households with Children Comparison
Immigrants from Peru
Panamanians
28.9%
FAMILY HOUSEHOLDS WITH CHILDREN
100.0/ 100
METRIC RATING
51st/ 347
METRIC RANK
28.2%
FAMILY HOUSEHOLDS WITH CHILDREN
99.3/ 100
METRIC RATING
93rd/ 347
METRIC RANK
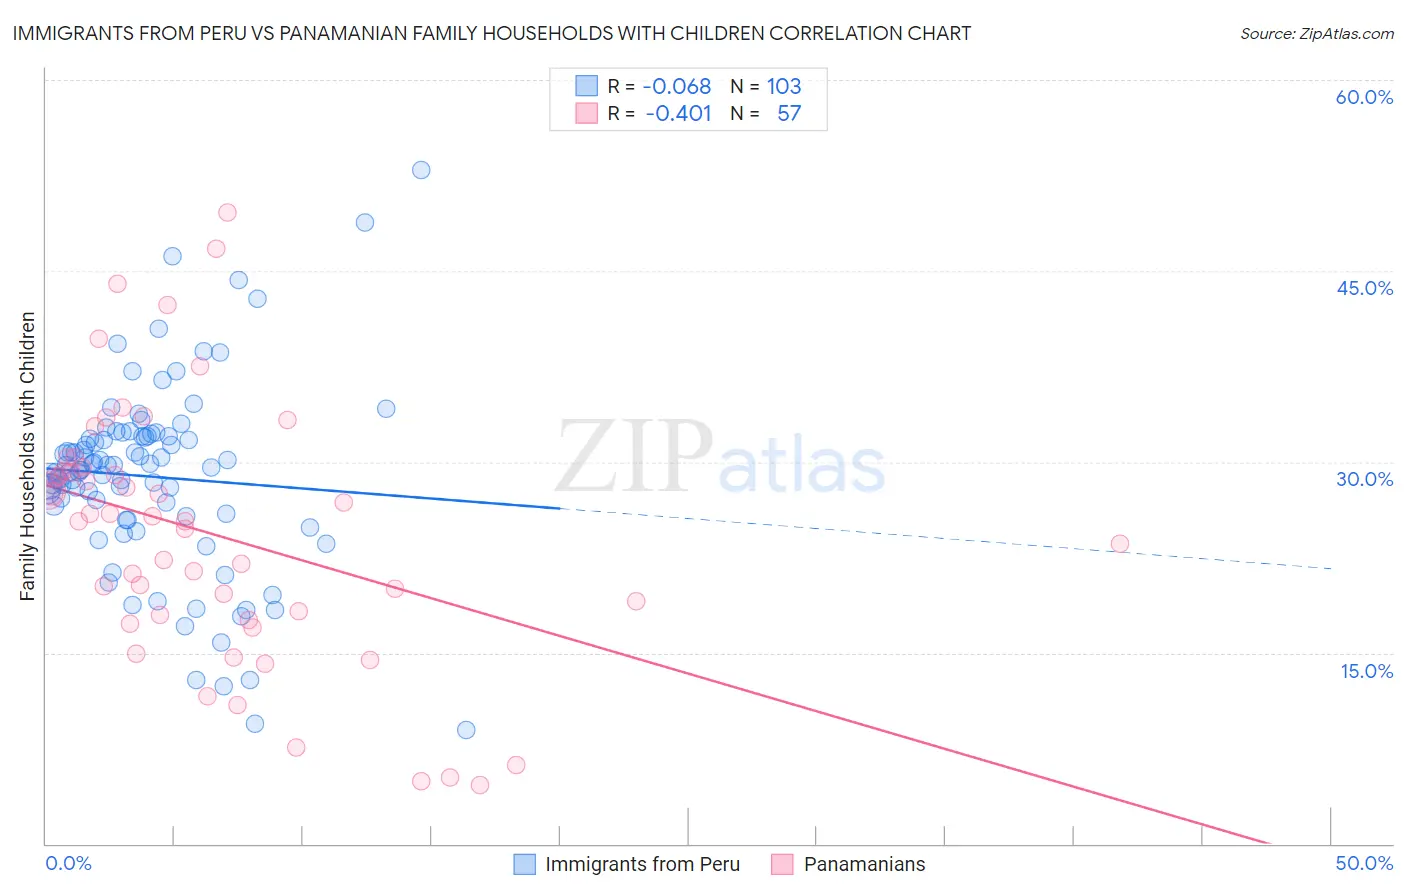
Immigrants from Peru vs Panamanian Family Households with Children Correlation Chart
The statistical analysis conducted on geographies consisting of 328,640,714 people shows a slight negative correlation between the proportion of Immigrants from Peru and percentage of family households with children in the United States with a correlation coefficient (R) of -0.068 and weighted average of 28.9%. Similarly, the statistical analysis conducted on geographies consisting of 281,035,493 people shows a moderate negative correlation between the proportion of Panamanians and percentage of family households with children in the United States with a correlation coefficient (R) of -0.401 and weighted average of 28.2%, a difference of 2.6%.
Family Households with Children Correlation Summary
| Measurement | Immigrants from Peru | Panamanian |
| Minimum | 9.0% | 4.6% |
| Maximum | 52.9% | 49.6% |
| Range | 44.0% | 45.0% |
| Mean | 28.8% | 24.4% |
| Median | 29.5% | 25.4% |
| Interquartile 25% (IQ1) | 25.8% | 17.8% |
| Interquartile 75% (IQ3) | 32.0% | 29.4% |
| Interquartile Range (IQR) | 6.2% | 11.7% |
| Standard Deviation (Sample) | 7.5% | 10.2% |
| Standard Deviation (Population) | 7.4% | 10.1% |
Similar Demographics by Family Households with Children
Demographics Similar to Immigrants from Peru by Family Households with Children
In terms of family households with children, the demographic groups most similar to Immigrants from Peru are Immigrants (28.9%, a difference of 0.040%), Guatemalan (28.9%, a difference of 0.080%), Jordanian (29.0%, a difference of 0.14%), Immigrants from Cambodia (28.9%, a difference of 0.15%), and Apache (29.0%, a difference of 0.23%).
| Demographics | Rating | Rank | Family Households with Children |
| Immigrants | Taiwan | 100.0 /100 | #44 | Exceptional 29.0% |
| Fijians | 100.0 /100 | #45 | Exceptional 29.0% |
| Immigrants | Philippines | 100.0 /100 | #46 | Exceptional 29.0% |
| Peruvians | 100.0 /100 | #47 | Exceptional 29.0% |
| Apache | 100.0 /100 | #48 | Exceptional 29.0% |
| Jordanians | 100.0 /100 | #49 | Exceptional 29.0% |
| Immigrants | Immigrants | 100.0 /100 | #50 | Exceptional 28.9% |
| Immigrants | Peru | 100.0 /100 | #51 | Exceptional 28.9% |
| Guatemalans | 100.0 /100 | #52 | Exceptional 28.9% |
| Immigrants | Cambodia | 100.0 /100 | #53 | Exceptional 28.9% |
| Sierra Leoneans | 100.0 /100 | #54 | Exceptional 28.9% |
| Immigrants | Asia | 100.0 /100 | #55 | Exceptional 28.8% |
| Immigrants | Guatemala | 100.0 /100 | #56 | Exceptional 28.8% |
| Danes | 100.0 /100 | #57 | Exceptional 28.7% |
| Hawaiians | 100.0 /100 | #58 | Exceptional 28.7% |
Demographics Similar to Panamanians by Family Households with Children
In terms of family households with children, the demographic groups most similar to Panamanians are Immigrants from Colombia (28.2%, a difference of 0.050%), Chickasaw (28.2%, a difference of 0.11%), Immigrants from Nicaragua (28.2%, a difference of 0.11%), Immigrants from Liberia (28.2%, a difference of 0.13%), and Ute (28.2%, a difference of 0.14%).
| Demographics | Rating | Rank | Family Households with Children |
| Immigrants | Western Africa | 99.6 /100 | #86 | Exceptional 28.3% |
| Colombians | 99.6 /100 | #87 | Exceptional 28.3% |
| Liberians | 99.6 /100 | #88 | Exceptional 28.3% |
| Immigrants | Costa Rica | 99.6 /100 | #89 | Exceptional 28.3% |
| Immigrants | Thailand | 99.5 /100 | #90 | Exceptional 28.2% |
| Immigrants | Liberia | 99.4 /100 | #91 | Exceptional 28.2% |
| Chickasaw | 99.4 /100 | #92 | Exceptional 28.2% |
| Panamanians | 99.3 /100 | #93 | Exceptional 28.2% |
| Immigrants | Colombia | 99.2 /100 | #94 | Exceptional 28.2% |
| Immigrants | Nicaragua | 99.1 /100 | #95 | Exceptional 28.2% |
| Ute | 99.1 /100 | #96 | Exceptional 28.2% |
| Chileans | 98.9 /100 | #97 | Exceptional 28.1% |
| Immigrants | Kenya | 98.9 /100 | #98 | Exceptional 28.1% |
| Immigrants | Azores | 98.8 /100 | #99 | Exceptional 28.1% |
| Indonesians | 98.8 /100 | #100 | Exceptional 28.1% |