Salvadoran vs Immigrants from Serbia Single Father Households
COMPARE
Salvadoran
Immigrants from Serbia
Single Father Households
Single Father Households Comparison
Salvadorans
Immigrants from Serbia
2.9%
SINGLE FATHER HOUSEHOLDS
0.0/ 100
METRIC RATING
314th/ 347
METRIC RANK
2.0%
SINGLE FATHER HOUSEHOLDS
99.9/ 100
METRIC RATING
49th/ 347
METRIC RANK
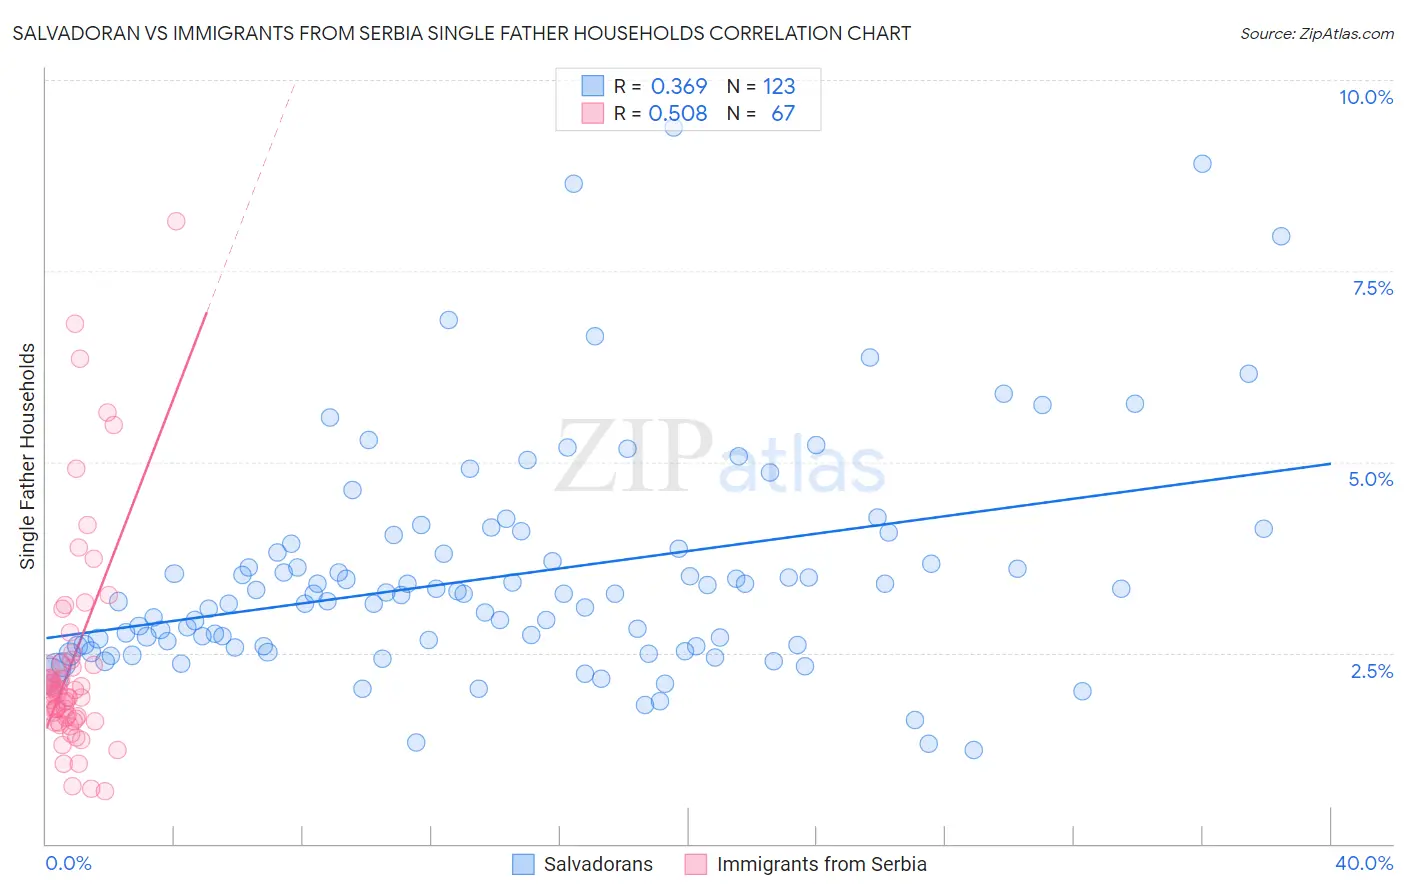
Salvadoran vs Immigrants from Serbia Single Father Households Correlation Chart
The statistical analysis conducted on geographies consisting of 395,913,017 people shows a mild positive correlation between the proportion of Salvadorans and percentage of single father households in the United States with a correlation coefficient (R) of 0.369 and weighted average of 2.9%. Similarly, the statistical analysis conducted on geographies consisting of 131,321,851 people shows a substantial positive correlation between the proportion of Immigrants from Serbia and percentage of single father households in the United States with a correlation coefficient (R) of 0.508 and weighted average of 2.0%, a difference of 44.3%.
Single Father Households Correlation Summary
| Measurement | Salvadoran | Immigrants from Serbia |
| Minimum | 1.2% | 0.69% |
| Maximum | 9.4% | 8.1% |
| Range | 8.1% | 7.5% |
| Mean | 3.5% | 2.4% |
| Median | 3.3% | 2.0% |
| Interquartile 25% (IQ1) | 2.6% | 1.6% |
| Interquartile 75% (IQ3) | 3.9% | 2.4% |
| Interquartile Range (IQR) | 1.3% | 0.74% |
| Standard Deviation (Sample) | 1.5% | 1.4% |
| Standard Deviation (Population) | 1.5% | 1.4% |
Similar Demographics by Single Father Households
Demographics Similar to Salvadorans by Single Father Households
In terms of single father households, the demographic groups most similar to Salvadorans are Arapaho (2.9%, a difference of 0.25%), Cheyenne (2.9%, a difference of 0.39%), Houma (2.9%, a difference of 0.39%), Tsimshian (2.9%, a difference of 0.67%), and Spanish American Indian (2.9%, a difference of 1.2%).
| Demographics | Rating | Rank | Single Father Households |
| Hopi | 0.0 /100 | #307 | Tragic 2.8% |
| Apache | 0.0 /100 | #308 | Tragic 2.8% |
| Central Americans | 0.0 /100 | #309 | Tragic 2.9% |
| Immigrants | Laos | 0.0 /100 | #310 | Tragic 2.9% |
| Spanish American Indians | 0.0 /100 | #311 | Tragic 2.9% |
| Tsimshian | 0.0 /100 | #312 | Tragic 2.9% |
| Arapaho | 0.0 /100 | #313 | Tragic 2.9% |
| Salvadorans | 0.0 /100 | #314 | Tragic 2.9% |
| Cheyenne | 0.0 /100 | #315 | Tragic 2.9% |
| Houma | 0.0 /100 | #316 | Tragic 2.9% |
| Immigrants | El Salvador | 0.0 /100 | #317 | Tragic 2.9% |
| Cape Verdeans | 0.0 /100 | #318 | Tragic 2.9% |
| Ute | 0.0 /100 | #319 | Tragic 3.0% |
| Guatemalans | 0.0 /100 | #320 | Tragic 3.0% |
| Mexicans | 0.0 /100 | #321 | Tragic 3.0% |
Demographics Similar to Immigrants from Serbia by Single Father Households
In terms of single father households, the demographic groups most similar to Immigrants from Serbia are Immigrants from Switzerland (2.0%, a difference of 0.0%), Immigrants from Poland (2.0%, a difference of 0.0%), Immigrants from Kazakhstan (2.0%, a difference of 0.010%), Immigrants from Ukraine (2.0%, a difference of 0.030%), and Immigrants from Europe (2.0%, a difference of 0.25%).
| Demographics | Rating | Rank | Single Father Households |
| Macedonians | 100.0 /100 | #42 | Exceptional 2.0% |
| Immigrants | Grenada | 100.0 /100 | #43 | Exceptional 2.0% |
| Latvians | 100.0 /100 | #44 | Exceptional 2.0% |
| Russians | 100.0 /100 | #45 | Exceptional 2.0% |
| Immigrants | Lebanon | 100.0 /100 | #46 | Exceptional 2.0% |
| Immigrants | Ukraine | 99.9 /100 | #47 | Exceptional 2.0% |
| Immigrants | Kazakhstan | 99.9 /100 | #48 | Exceptional 2.0% |
| Immigrants | Serbia | 99.9 /100 | #49 | Exceptional 2.0% |
| Immigrants | Switzerland | 99.9 /100 | #50 | Exceptional 2.0% |
| Immigrants | Poland | 99.9 /100 | #51 | Exceptional 2.0% |
| Immigrants | Europe | 99.9 /100 | #52 | Exceptional 2.0% |
| Immigrants | Northern Europe | 99.9 /100 | #53 | Exceptional 2.0% |
| Immigrants | Korea | 99.9 /100 | #54 | Exceptional 2.0% |
| Immigrants | France | 99.9 /100 | #55 | Exceptional 2.0% |
| Immigrants | Norway | 99.9 /100 | #56 | Exceptional 2.0% |