Immigrants from Czechoslovakia vs Immigrants from Somalia Single Father Households
COMPARE
Immigrants from Czechoslovakia
Immigrants from Somalia
Single Father Households
Single Father Households Comparison
Immigrants from Czechoslovakia
Immigrants from Somalia
2.0%
SINGLE FATHER HOUSEHOLDS
99.9/ 100
METRIC RATING
58th/ 347
METRIC RANK
2.5%
SINGLE FATHER HOUSEHOLDS
1.9/ 100
METRIC RATING
253rd/ 347
METRIC RANK
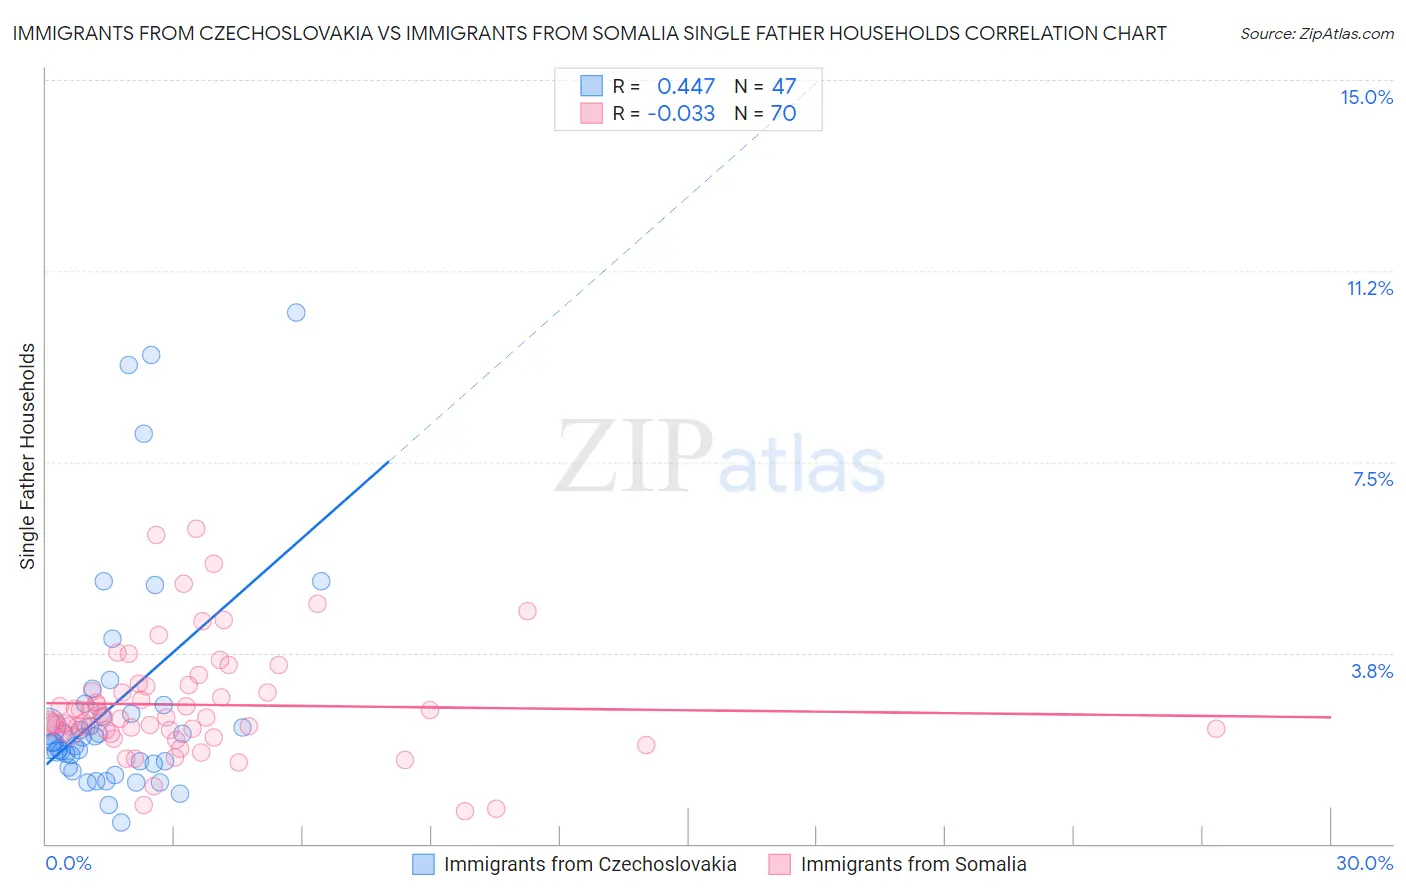
Immigrants from Czechoslovakia vs Immigrants from Somalia Single Father Households Correlation Chart
The statistical analysis conducted on geographies consisting of 194,565,080 people shows a moderate positive correlation between the proportion of Immigrants from Czechoslovakia and percentage of single father households in the United States with a correlation coefficient (R) of 0.447 and weighted average of 2.0%. Similarly, the statistical analysis conducted on geographies consisting of 91,982,855 people shows no correlation between the proportion of Immigrants from Somalia and percentage of single father households in the United States with a correlation coefficient (R) of -0.033 and weighted average of 2.5%, a difference of 23.3%.
Single Father Households Correlation Summary
| Measurement | Immigrants from Czechoslovakia | Immigrants from Somalia |
| Minimum | 0.41% | 0.64% |
| Maximum | 10.4% | 6.2% |
| Range | 10.0% | 5.5% |
| Mean | 2.8% | 2.7% |
| Median | 2.0% | 2.5% |
| Interquartile 25% (IQ1) | 1.6% | 2.2% |
| Interquartile 75% (IQ3) | 2.7% | 3.1% |
| Interquartile Range (IQR) | 1.2% | 0.90% |
| Standard Deviation (Sample) | 2.3% | 1.1% |
| Standard Deviation (Population) | 2.3% | 1.1% |
Similar Demographics by Single Father Households
Demographics Similar to Immigrants from Czechoslovakia by Single Father Households
In terms of single father households, the demographic groups most similar to Immigrants from Czechoslovakia are Burmese (2.0%, a difference of 0.020%), Immigrants from North Macedonia (2.0%, a difference of 0.11%), Immigrants from Austria (2.0%, a difference of 0.11%), Immigrants from Norway (2.0%, a difference of 0.29%), and Immigrants from France (2.0%, a difference of 0.31%).
| Demographics | Rating | Rank | Single Father Households |
| Immigrants | Poland | 99.9 /100 | #51 | Exceptional 2.0% |
| Immigrants | Europe | 99.9 /100 | #52 | Exceptional 2.0% |
| Immigrants | Northern Europe | 99.9 /100 | #53 | Exceptional 2.0% |
| Immigrants | Korea | 99.9 /100 | #54 | Exceptional 2.0% |
| Immigrants | France | 99.9 /100 | #55 | Exceptional 2.0% |
| Immigrants | Norway | 99.9 /100 | #56 | Exceptional 2.0% |
| Burmese | 99.9 /100 | #57 | Exceptional 2.0% |
| Immigrants | Czechoslovakia | 99.9 /100 | #58 | Exceptional 2.0% |
| Immigrants | North Macedonia | 99.9 /100 | #59 | Exceptional 2.0% |
| Immigrants | Austria | 99.9 /100 | #60 | Exceptional 2.0% |
| Vietnamese | 99.9 /100 | #61 | Exceptional 2.0% |
| Immigrants | Malaysia | 99.9 /100 | #62 | Exceptional 2.0% |
| Maltese | 99.9 /100 | #63 | Exceptional 2.0% |
| Mongolians | 99.9 /100 | #64 | Exceptional 2.1% |
| Paraguayans | 99.9 /100 | #65 | Exceptional 2.1% |
Demographics Similar to Immigrants from Somalia by Single Father Households
In terms of single father households, the demographic groups most similar to Immigrants from Somalia are Immigrants from Thailand (2.5%, a difference of 0.040%), Immigrants from Eritrea (2.5%, a difference of 0.070%), Liberian (2.5%, a difference of 0.090%), Somali (2.5%, a difference of 0.18%), and Immigrants from Cameroon (2.5%, a difference of 0.35%).
| Demographics | Rating | Rank | Single Father Households |
| Native Hawaiians | 2.5 /100 | #246 | Tragic 2.5% |
| Delaware | 2.5 /100 | #247 | Tragic 2.5% |
| Bahamians | 2.4 /100 | #248 | Tragic 2.5% |
| Immigrants | Cameroon | 2.3 /100 | #249 | Tragic 2.5% |
| Somalis | 2.1 /100 | #250 | Tragic 2.5% |
| Liberians | 2.0 /100 | #251 | Tragic 2.5% |
| Immigrants | Eritrea | 2.0 /100 | #252 | Tragic 2.5% |
| Immigrants | Somalia | 1.9 /100 | #253 | Tragic 2.5% |
| Immigrants | Thailand | 1.8 /100 | #254 | Tragic 2.5% |
| Tongans | 1.5 /100 | #255 | Tragic 2.5% |
| Potawatomi | 1.4 /100 | #256 | Tragic 2.5% |
| Immigrants | Congo | 1.2 /100 | #257 | Tragic 2.5% |
| Spanish | 1.1 /100 | #258 | Tragic 2.5% |
| Comanche | 1.0 /100 | #259 | Tragic 2.5% |
| Immigrants | Caribbean | 1.0 /100 | #260 | Tragic 2.5% |