French vs Iraqi Currently Married
COMPARE
French
Iraqi
Currently Married
Currently Married Comparison
French
Iraqis
48.4%
CURRENTLY MARRIED
98.6/ 100
METRIC RATING
58th/ 347
METRIC RANK
46.9%
CURRENTLY MARRIED
66.4/ 100
METRIC RATING
159th/ 347
METRIC RANK
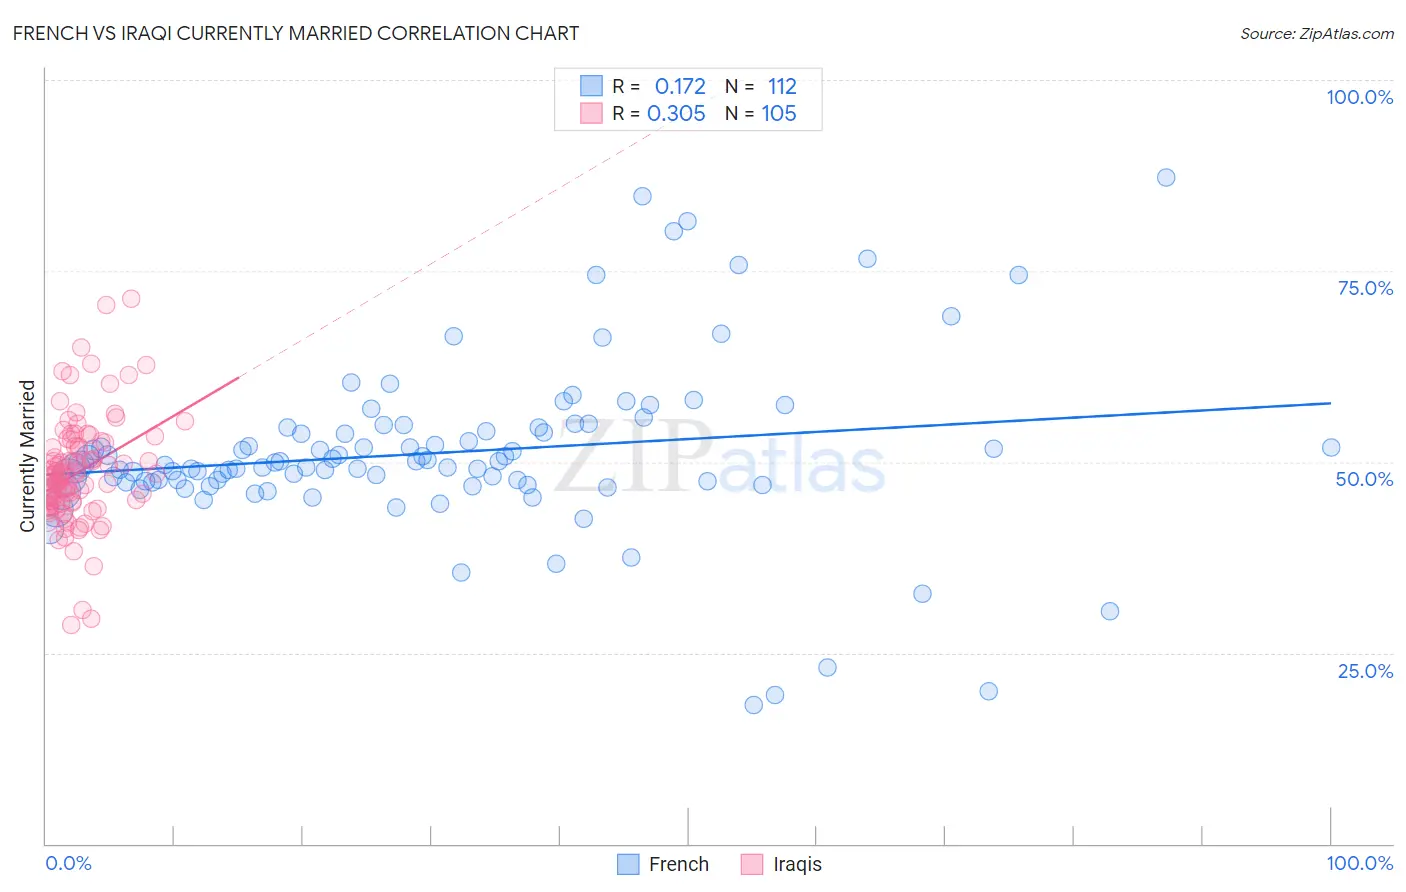
French vs Iraqi Currently Married Correlation Chart
The statistical analysis conducted on geographies consisting of 572,298,467 people shows a poor positive correlation between the proportion of French and percentage of population currently married in the United States with a correlation coefficient (R) of 0.172 and weighted average of 48.4%. Similarly, the statistical analysis conducted on geographies consisting of 170,656,152 people shows a mild positive correlation between the proportion of Iraqis and percentage of population currently married in the United States with a correlation coefficient (R) of 0.305 and weighted average of 46.9%, a difference of 3.2%.
Currently Married Correlation Summary
| Measurement | French | Iraqi |
| Minimum | 18.1% | 28.7% |
| Maximum | 87.2% | 71.4% |
| Range | 69.1% | 42.7% |
| Mean | 51.2% | 48.7% |
| Median | 49.6% | 48.1% |
| Interquartile 25% (IQ1) | 47.3% | 44.6% |
| Interquartile 75% (IQ3) | 54.2% | 52.3% |
| Interquartile Range (IQR) | 6.9% | 7.7% |
| Standard Deviation (Sample) | 11.4% | 7.1% |
| Standard Deviation (Population) | 11.3% | 7.1% |
Similar Demographics by Currently Married
Demographics Similar to French by Currently Married
In terms of currently married, the demographic groups most similar to French are Immigrants from Ireland (48.4%, a difference of 0.030%), Immigrants from Netherlands (48.5%, a difference of 0.040%), Immigrants from Romania (48.4%, a difference of 0.040%), Romanian (48.4%, a difference of 0.050%), and Asian (48.4%, a difference of 0.060%).
| Demographics | Rating | Rank | Currently Married |
| Whites/Caucasians | 99.0 /100 | #51 | Exceptional 48.6% |
| Russians | 98.9 /100 | #52 | Exceptional 48.6% |
| Immigrants | Austria | 98.8 /100 | #53 | Exceptional 48.5% |
| Immigrants | Moldova | 98.7 /100 | #54 | Exceptional 48.5% |
| Immigrants | North Macedonia | 98.7 /100 | #55 | Exceptional 48.5% |
| Latvians | 98.7 /100 | #56 | Exceptional 48.5% |
| Immigrants | Netherlands | 98.6 /100 | #57 | Exceptional 48.5% |
| French | 98.6 /100 | #58 | Exceptional 48.4% |
| Immigrants | Ireland | 98.5 /100 | #59 | Exceptional 48.4% |
| Immigrants | Romania | 98.5 /100 | #60 | Exceptional 48.4% |
| Romanians | 98.5 /100 | #61 | Exceptional 48.4% |
| Asians | 98.5 /100 | #62 | Exceptional 48.4% |
| Slavs | 98.3 /100 | #63 | Exceptional 48.4% |
| Immigrants | Czechoslovakia | 98.3 /100 | #64 | Exceptional 48.4% |
| Ukrainians | 98.3 /100 | #65 | Exceptional 48.4% |
Demographics Similar to Iraqis by Currently Married
In terms of currently married, the demographic groups most similar to Iraqis are Cherokee (46.9%, a difference of 0.020%), Immigrants from Uzbekistan (46.9%, a difference of 0.020%), Immigrants from Southern Europe (46.9%, a difference of 0.020%), Nonimmigrants (46.9%, a difference of 0.040%), and Immigrants from Switzerland (46.9%, a difference of 0.060%).
| Demographics | Rating | Rank | Currently Married |
| Immigrants | Serbia | 68.8 /100 | #152 | Good 47.0% |
| Immigrants | Venezuela | 68.6 /100 | #153 | Good 47.0% |
| Albanians | 68.6 /100 | #154 | Good 47.0% |
| Arabs | 68.6 /100 | #155 | Good 47.0% |
| Spanish | 68.1 /100 | #156 | Good 47.0% |
| Immigrants | Switzerland | 67.8 /100 | #157 | Good 46.9% |
| Cherokee | 66.8 /100 | #158 | Good 46.9% |
| Iraqis | 66.4 /100 | #159 | Good 46.9% |
| Immigrants | Uzbekistan | 66.0 /100 | #160 | Good 46.9% |
| Immigrants | Southern Europe | 65.9 /100 | #161 | Good 46.9% |
| Immigrants | Nonimmigrants | 65.4 /100 | #162 | Good 46.9% |
| Delaware | 64.7 /100 | #163 | Good 46.9% |
| Immigrants | Western Asia | 64.2 /100 | #164 | Good 46.9% |
| Samoans | 59.8 /100 | #165 | Average 46.8% |
| Immigrants | Syria | 59.3 /100 | #166 | Average 46.8% |