Immigrants from Croatia vs Hungarian Family Households
COMPARE
Immigrants from Croatia
Hungarian
Family Households
Family Households Comparison
Immigrants from Croatia
Hungarians
63.1%
FAMILY HOUSEHOLDS
0.3/ 100
METRIC RATING
271st/ 347
METRIC RANK
64.9%
FAMILY HOUSEHOLDS
94.0/ 100
METRIC RATING
121st/ 347
METRIC RANK
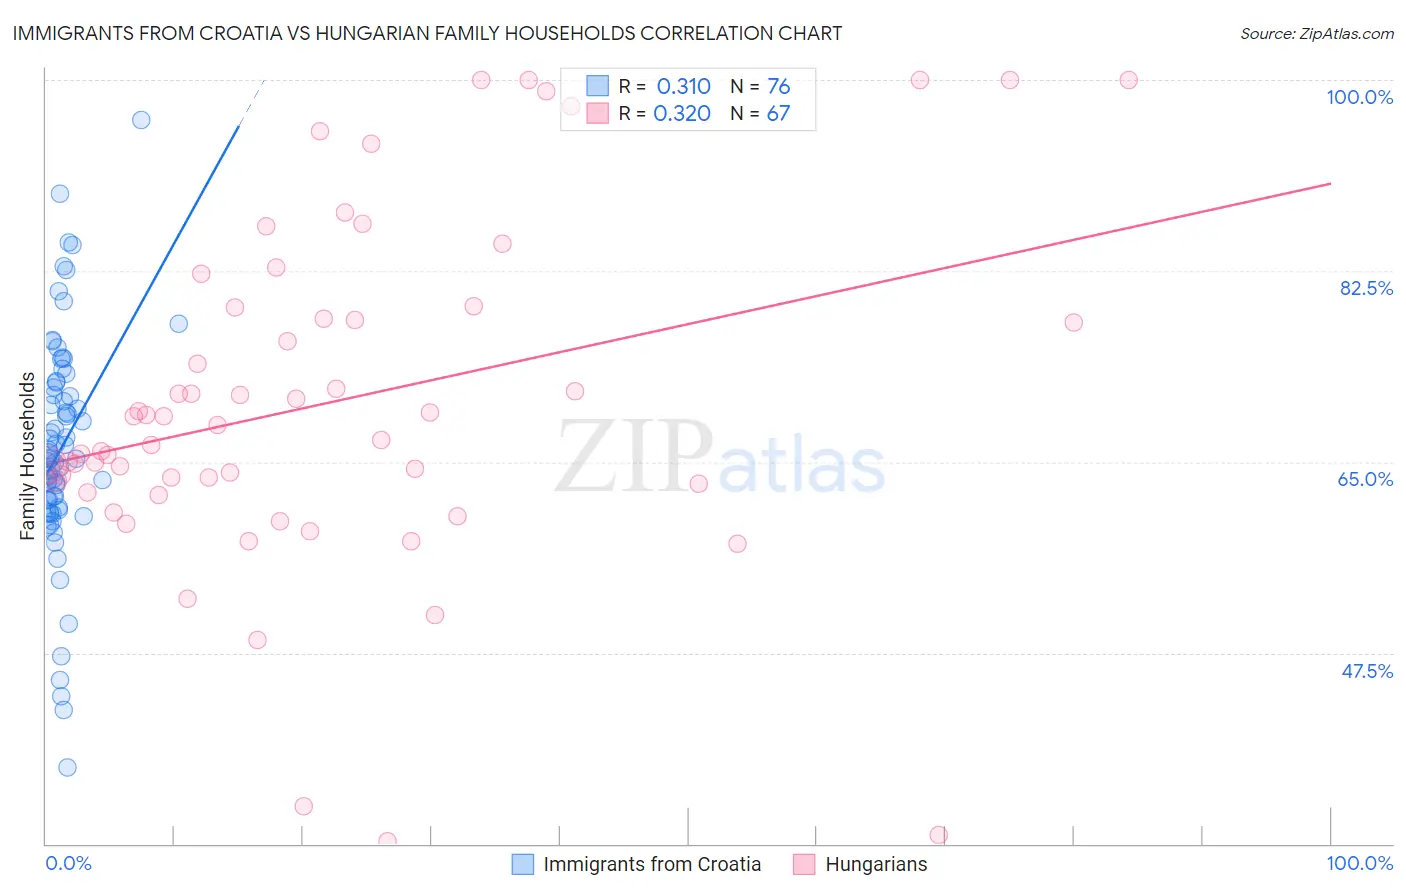
Immigrants from Croatia vs Hungarian Family Households Correlation Chart
The statistical analysis conducted on geographies consisting of 132,568,699 people shows a mild positive correlation between the proportion of Immigrants from Croatia and percentage of family households in the United States with a correlation coefficient (R) of 0.310 and weighted average of 63.1%. Similarly, the statistical analysis conducted on geographies consisting of 485,906,921 people shows a mild positive correlation between the proportion of Hungarians and percentage of family households in the United States with a correlation coefficient (R) of 0.320 and weighted average of 64.9%, a difference of 2.9%.
Family Households Correlation Summary
| Measurement | Immigrants from Croatia | Hungarian |
| Minimum | 36.9% | 30.2% |
| Maximum | 96.4% | 100.0% |
| Range | 59.4% | 69.8% |
| Mean | 66.3% | 70.5% |
| Median | 65.4% | 68.4% |
| Interquartile 25% (IQ1) | 60.7% | 63.0% |
| Interquartile 75% (IQ3) | 72.1% | 79.1% |
| Interquartile Range (IQR) | 11.4% | 16.1% |
| Standard Deviation (Sample) | 10.3% | 15.7% |
| Standard Deviation (Population) | 10.3% | 15.6% |
Similar Demographics by Family Households
Demographics Similar to Immigrants from Croatia by Family Households
In terms of family households, the demographic groups most similar to Immigrants from Croatia are Immigrants from Turkey (63.1%, a difference of 0.0%), Immigrants from Austria (63.1%, a difference of 0.010%), Immigrants from Kazakhstan (63.1%, a difference of 0.010%), Lumbee (63.1%, a difference of 0.020%), and West Indian (63.1%, a difference of 0.020%).
| Demographics | Rating | Rank | Family Households |
| Kenyans | 0.5 /100 | #264 | Tragic 63.2% |
| Colville | 0.5 /100 | #265 | Tragic 63.2% |
| Immigrants | Western Africa | 0.5 /100 | #266 | Tragic 63.1% |
| Israelis | 0.4 /100 | #267 | Tragic 63.1% |
| Immigrants | Singapore | 0.4 /100 | #268 | Tragic 63.1% |
| Yugoslavians | 0.4 /100 | #269 | Tragic 63.1% |
| Immigrants | Austria | 0.3 /100 | #270 | Tragic 63.1% |
| Immigrants | Croatia | 0.3 /100 | #271 | Tragic 63.1% |
| Immigrants | Turkey | 0.3 /100 | #272 | Tragic 63.1% |
| Immigrants | Kazakhstan | 0.3 /100 | #273 | Tragic 63.1% |
| Lumbee | 0.3 /100 | #274 | Tragic 63.1% |
| West Indians | 0.3 /100 | #275 | Tragic 63.1% |
| Serbians | 0.3 /100 | #276 | Tragic 63.0% |
| Ottawa | 0.3 /100 | #277 | Tragic 63.0% |
| Immigrants | Belgium | 0.2 /100 | #278 | Tragic 63.0% |
Demographics Similar to Hungarians by Family Households
In terms of family households, the demographic groups most similar to Hungarians are Immigrants from Oceania (64.9%, a difference of 0.010%), Immigrants from Eastern Asia (64.9%, a difference of 0.020%), Hmong (64.9%, a difference of 0.040%), Choctaw (64.9%, a difference of 0.040%), and Immigrants from Argentina (64.9%, a difference of 0.060%).
| Demographics | Rating | Rank | Family Households |
| Argentineans | 95.7 /100 | #114 | Exceptional 65.0% |
| Ecuadorians | 95.4 /100 | #115 | Exceptional 65.0% |
| Immigrants | Iraq | 95.4 /100 | #116 | Exceptional 65.0% |
| Cherokee | 95.3 /100 | #117 | Exceptional 65.0% |
| Dutch | 95.1 /100 | #118 | Exceptional 64.9% |
| Immigrants | Eastern Asia | 94.4 /100 | #119 | Exceptional 64.9% |
| Immigrants | Oceania | 94.2 /100 | #120 | Exceptional 64.9% |
| Hungarians | 94.0 /100 | #121 | Exceptional 64.9% |
| Hmong | 93.4 /100 | #122 | Exceptional 64.9% |
| Choctaw | 93.4 /100 | #123 | Exceptional 64.9% |
| Immigrants | Argentina | 92.8 /100 | #124 | Exceptional 64.9% |
| Immigrants | Belize | 92.7 /100 | #125 | Exceptional 64.9% |
| Panamanians | 92.4 /100 | #126 | Exceptional 64.8% |
| Immigrants | Panama | 92.0 /100 | #127 | Exceptional 64.8% |
| Italians | 91.9 /100 | #128 | Exceptional 64.8% |