Immigrants from Peru vs Hungarian Family Households
COMPARE
Immigrants from Peru
Hungarian
Family Households
Family Households Comparison
Immigrants from Peru
Hungarians
67.2%
FAMILY HOUSEHOLDS
100.0/ 100
METRIC RATING
30th/ 347
METRIC RANK
64.9%
FAMILY HOUSEHOLDS
94.0/ 100
METRIC RATING
121st/ 347
METRIC RANK
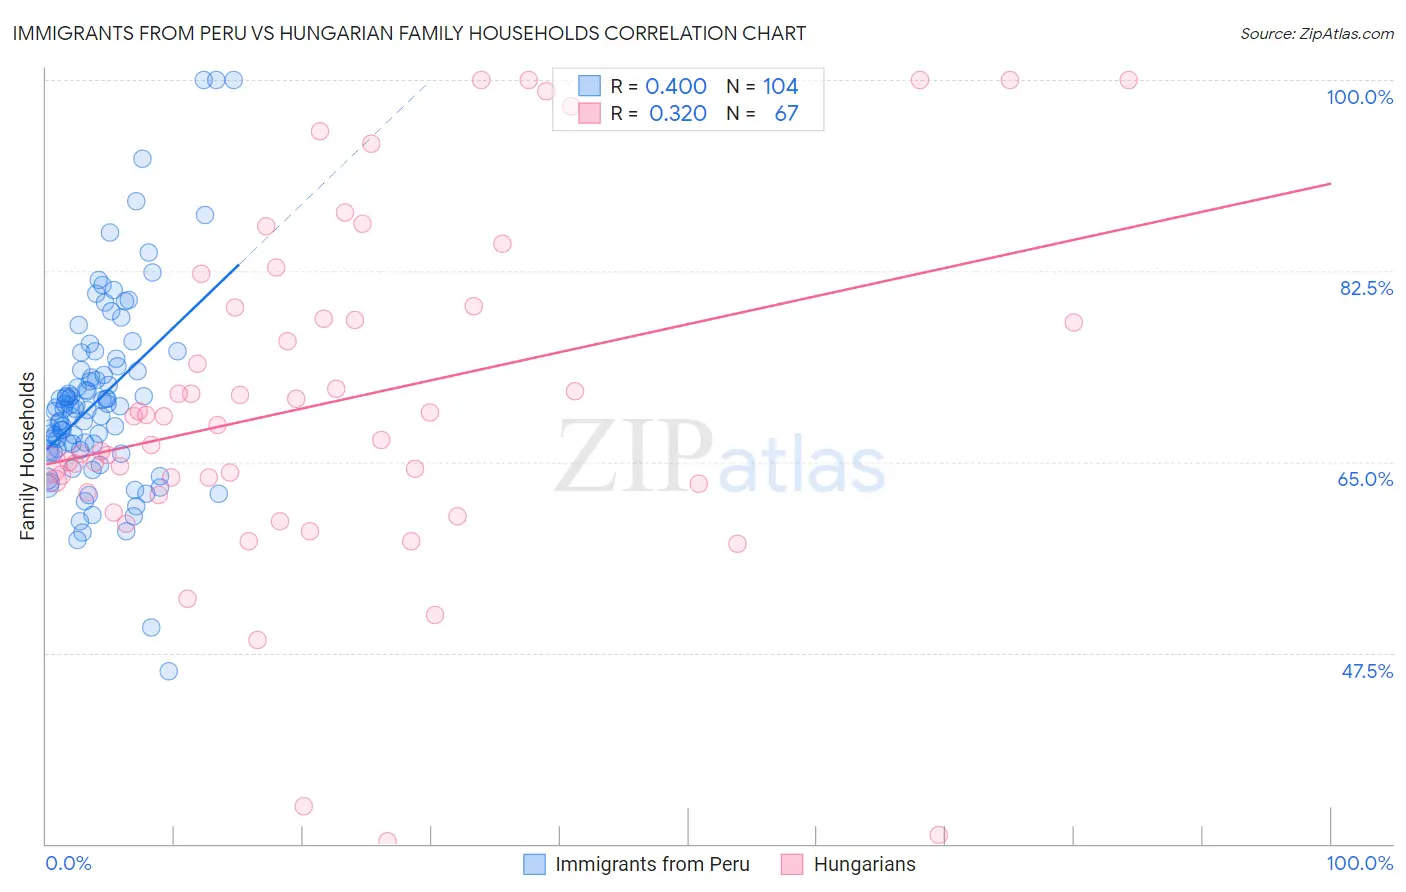
Immigrants from Peru vs Hungarian Family Households Correlation Chart
The statistical analysis conducted on geographies consisting of 328,761,314 people shows a mild positive correlation between the proportion of Immigrants from Peru and percentage of family households in the United States with a correlation coefficient (R) of 0.400 and weighted average of 67.2%. Similarly, the statistical analysis conducted on geographies consisting of 485,906,921 people shows a mild positive correlation between the proportion of Hungarians and percentage of family households in the United States with a correlation coefficient (R) of 0.320 and weighted average of 64.9%, a difference of 3.6%.
Family Households Correlation Summary
| Measurement | Immigrants from Peru | Hungarian |
| Minimum | 45.8% | 30.2% |
| Maximum | 100.0% | 100.0% |
| Range | 54.2% | 69.8% |
| Mean | 70.8% | 70.5% |
| Median | 69.9% | 68.4% |
| Interquartile 25% (IQ1) | 66.1% | 63.0% |
| Interquartile 75% (IQ3) | 73.6% | 79.1% |
| Interquartile Range (IQR) | 7.5% | 16.1% |
| Standard Deviation (Sample) | 9.0% | 15.7% |
| Standard Deviation (Population) | 8.9% | 15.6% |
Similar Demographics by Family Households
Demographics Similar to Immigrants from Peru by Family Households
In terms of family households, the demographic groups most similar to Immigrants from Peru are Immigrants from Latin America (67.2%, a difference of 0.010%), Nepalese (67.2%, a difference of 0.070%), Salvadoran (67.2%, a difference of 0.11%), Thai (67.2%, a difference of 0.12%), and Tohono O'odham (67.1%, a difference of 0.17%).
| Demographics | Rating | Rank | Family Households |
| Immigrants | Pakistan | 100.0 /100 | #23 | Exceptional 67.7% |
| Immigrants | South Eastern Asia | 100.0 /100 | #24 | Exceptional 67.5% |
| Immigrants | Nicaragua | 100.0 /100 | #25 | Exceptional 67.5% |
| Immigrants | India | 100.0 /100 | #26 | Exceptional 67.4% |
| Hispanics or Latinos | 100.0 /100 | #27 | Exceptional 67.4% |
| Hawaiians | 100.0 /100 | #28 | Exceptional 67.4% |
| Nicaraguans | 100.0 /100 | #29 | Exceptional 67.4% |
| Immigrants | Peru | 100.0 /100 | #30 | Exceptional 67.2% |
| Immigrants | Latin America | 100.0 /100 | #31 | Exceptional 67.2% |
| Nepalese | 100.0 /100 | #32 | Exceptional 67.2% |
| Salvadorans | 100.0 /100 | #33 | Exceptional 67.2% |
| Thais | 100.0 /100 | #34 | Exceptional 67.2% |
| Tohono O'odham | 100.0 /100 | #35 | Exceptional 67.1% |
| Peruvians | 100.0 /100 | #36 | Exceptional 67.1% |
| Tsimshian | 100.0 /100 | #37 | Exceptional 67.1% |
Demographics Similar to Hungarians by Family Households
In terms of family households, the demographic groups most similar to Hungarians are Immigrants from Oceania (64.9%, a difference of 0.010%), Immigrants from Eastern Asia (64.9%, a difference of 0.020%), Hmong (64.9%, a difference of 0.040%), Choctaw (64.9%, a difference of 0.040%), and Immigrants from Argentina (64.9%, a difference of 0.060%).
| Demographics | Rating | Rank | Family Households |
| Argentineans | 95.7 /100 | #114 | Exceptional 65.0% |
| Ecuadorians | 95.4 /100 | #115 | Exceptional 65.0% |
| Immigrants | Iraq | 95.4 /100 | #116 | Exceptional 65.0% |
| Cherokee | 95.3 /100 | #117 | Exceptional 65.0% |
| Dutch | 95.1 /100 | #118 | Exceptional 64.9% |
| Immigrants | Eastern Asia | 94.4 /100 | #119 | Exceptional 64.9% |
| Immigrants | Oceania | 94.2 /100 | #120 | Exceptional 64.9% |
| Hungarians | 94.0 /100 | #121 | Exceptional 64.9% |
| Hmong | 93.4 /100 | #122 | Exceptional 64.9% |
| Choctaw | 93.4 /100 | #123 | Exceptional 64.9% |
| Immigrants | Argentina | 92.8 /100 | #124 | Exceptional 64.9% |
| Immigrants | Belize | 92.7 /100 | #125 | Exceptional 64.9% |
| Panamanians | 92.4 /100 | #126 | Exceptional 64.8% |
| Immigrants | Panama | 92.0 /100 | #127 | Exceptional 64.8% |
| Italians | 91.9 /100 | #128 | Exceptional 64.8% |