Immigrants from Congo vs Immigrants from Romania Unemployment Among Ages 45 to 54 years
COMPARE
Immigrants from Congo
Immigrants from Romania
Unemployment Among Ages 45 to 54 years
Unemployment Among Ages 45 to 54 years Comparison
Immigrants from Congo
Immigrants from Romania
4.4%
UNEMPLOYMENT AMONG AGES 45 TO 54 YEARS
81.8/ 100
METRIC RATING
138th/ 347
METRIC RANK
4.4%
UNEMPLOYMENT AMONG AGES 45 TO 54 YEARS
90.0/ 100
METRIC RATING
118th/ 347
METRIC RANK
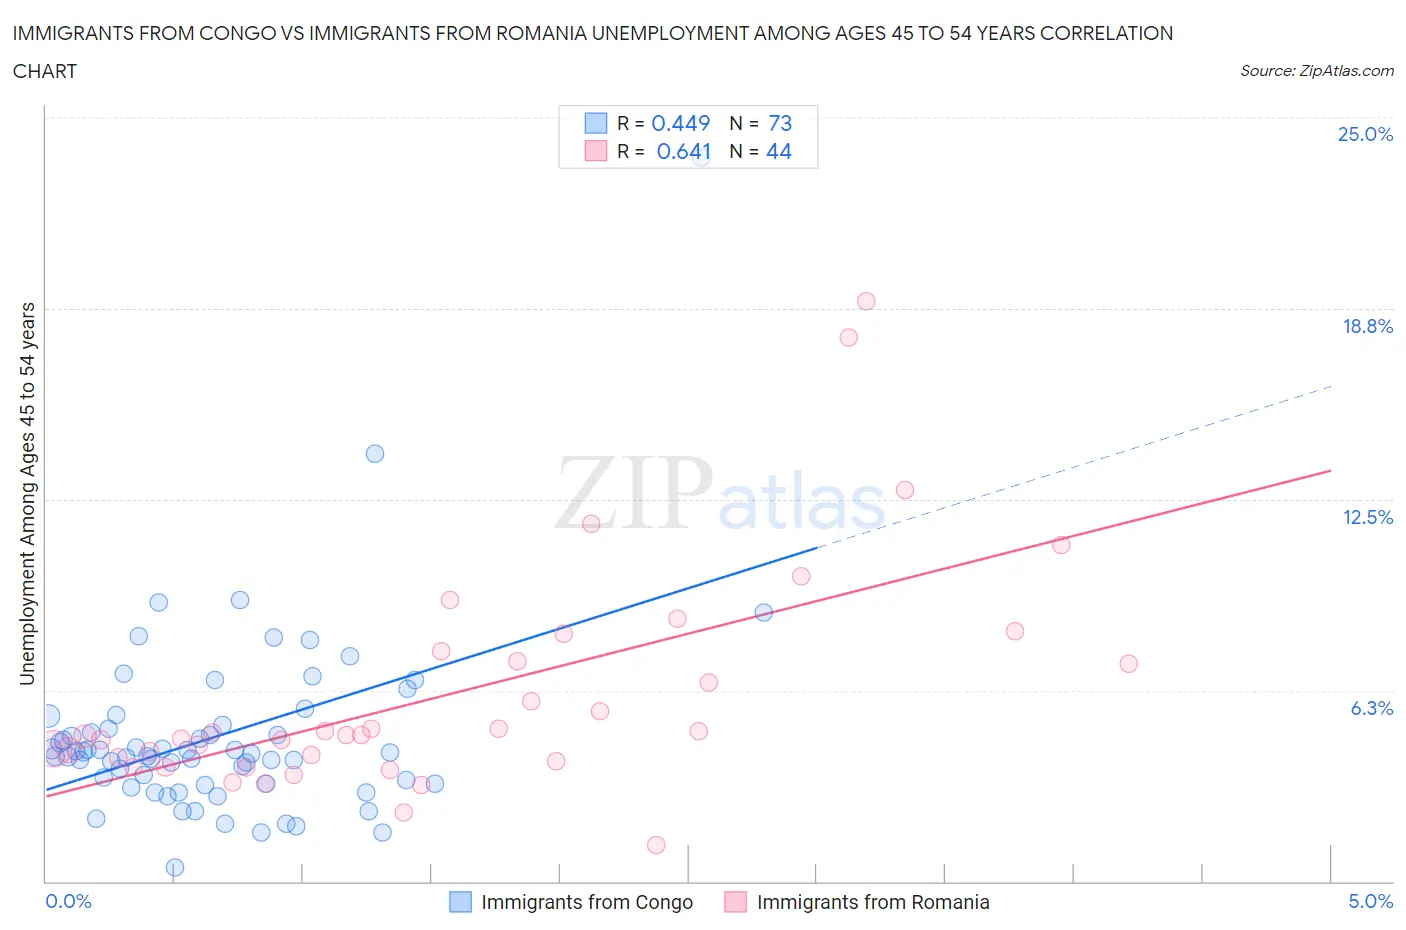
Immigrants from Congo vs Immigrants from Romania Unemployment Among Ages 45 to 54 years Correlation Chart
The statistical analysis conducted on geographies consisting of 91,534,278 people shows a moderate positive correlation between the proportion of Immigrants from Congo and unemployment rate among population between the ages 45 and 54 in the United States with a correlation coefficient (R) of 0.449 and weighted average of 4.4%. Similarly, the statistical analysis conducted on geographies consisting of 253,287,738 people shows a significant positive correlation between the proportion of Immigrants from Romania and unemployment rate among population between the ages 45 and 54 in the United States with a correlation coefficient (R) of 0.641 and weighted average of 4.4%, a difference of 0.84%.
Unemployment Among Ages 45 to 54 years Correlation Summary
| Measurement | Immigrants from Congo | Immigrants from Romania |
| Minimum | 0.45% | 1.2% |
| Maximum | 23.7% | 19.0% |
| Range | 23.3% | 17.8% |
| Mean | 4.7% | 6.1% |
| Median | 4.2% | 4.8% |
| Interquartile 25% (IQ1) | 3.2% | 4.0% |
| Interquartile 75% (IQ3) | 5.1% | 7.4% |
| Interquartile Range (IQR) | 1.9% | 3.4% |
| Standard Deviation (Sample) | 3.1% | 3.7% |
| Standard Deviation (Population) | 3.1% | 3.6% |
Demographics Similar to Immigrants from Congo and Immigrants from Romania by Unemployment Among Ages 45 to 54 years
In terms of unemployment among ages 45 to 54 years, the demographic groups most similar to Immigrants from Congo are Lebanese (4.4%, a difference of 0.010%), Immigrants from Middle Africa (4.4%, a difference of 0.13%), Immigrants from Eastern Asia (4.4%, a difference of 0.19%), Afghan (4.4%, a difference of 0.24%), and Immigrants from Cameroon (4.4%, a difference of 0.26%). Similarly, the demographic groups most similar to Immigrants from Romania are Native Hawaiian (4.4%, a difference of 0.010%), American (4.4%, a difference of 0.060%), Immigrants from Oceania (4.4%, a difference of 0.070%), Immigrants from Kazakhstan (4.4%, a difference of 0.070%), and Immigrants from Asia (4.4%, a difference of 0.16%).
| Demographics | Rating | Rank | Unemployment Among Ages 45 to 54 years |
| Immigrants | Romania | 90.0 /100 | #118 | Exceptional 4.4% |
| Native Hawaiians | 90.0 /100 | #119 | Excellent 4.4% |
| Americans | 89.6 /100 | #120 | Excellent 4.4% |
| Immigrants | Oceania | 89.5 /100 | #121 | Excellent 4.4% |
| Immigrants | Kazakhstan | 89.5 /100 | #122 | Excellent 4.4% |
| Immigrants | Asia | 88.8 /100 | #123 | Excellent 4.4% |
| Spanish | 88.8 /100 | #124 | Excellent 4.4% |
| Immigrants | Vietnam | 88.6 /100 | #125 | Excellent 4.4% |
| Immigrants | Czechoslovakia | 87.8 /100 | #126 | Excellent 4.4% |
| Nicaraguans | 87.6 /100 | #127 | Excellent 4.4% |
| Immigrants | Northern Europe | 86.9 /100 | #128 | Excellent 4.4% |
| Laotians | 86.3 /100 | #129 | Excellent 4.4% |
| Celtics | 86.2 /100 | #130 | Excellent 4.4% |
| Immigrants | Germany | 85.9 /100 | #131 | Excellent 4.4% |
| Immigrants | Eastern Africa | 85.1 /100 | #132 | Excellent 4.4% |
| Immigrants | Cameroon | 84.8 /100 | #133 | Excellent 4.4% |
| Afghans | 84.6 /100 | #134 | Excellent 4.4% |
| Immigrants | Eastern Asia | 84.0 /100 | #135 | Excellent 4.4% |
| Immigrants | Middle Africa | 83.3 /100 | #136 | Excellent 4.4% |
| Lebanese | 81.9 /100 | #137 | Excellent 4.4% |
| Immigrants | Congo | 81.8 /100 | #138 | Excellent 4.4% |