Osage vs Immigrants from Romania Family Households with Children
COMPARE
Osage
Immigrants from Romania
Family Households with Children
Family Households with Children Comparison
Osage
Immigrants from Romania
27.6%
FAMILY HOUSEHOLDS WITH CHILDREN
79.0/ 100
METRIC RATING
148th/ 347
METRIC RANK
27.4%
FAMILY HOUSEHOLDS WITH CHILDREN
34.4/ 100
METRIC RATING
198th/ 347
METRIC RANK
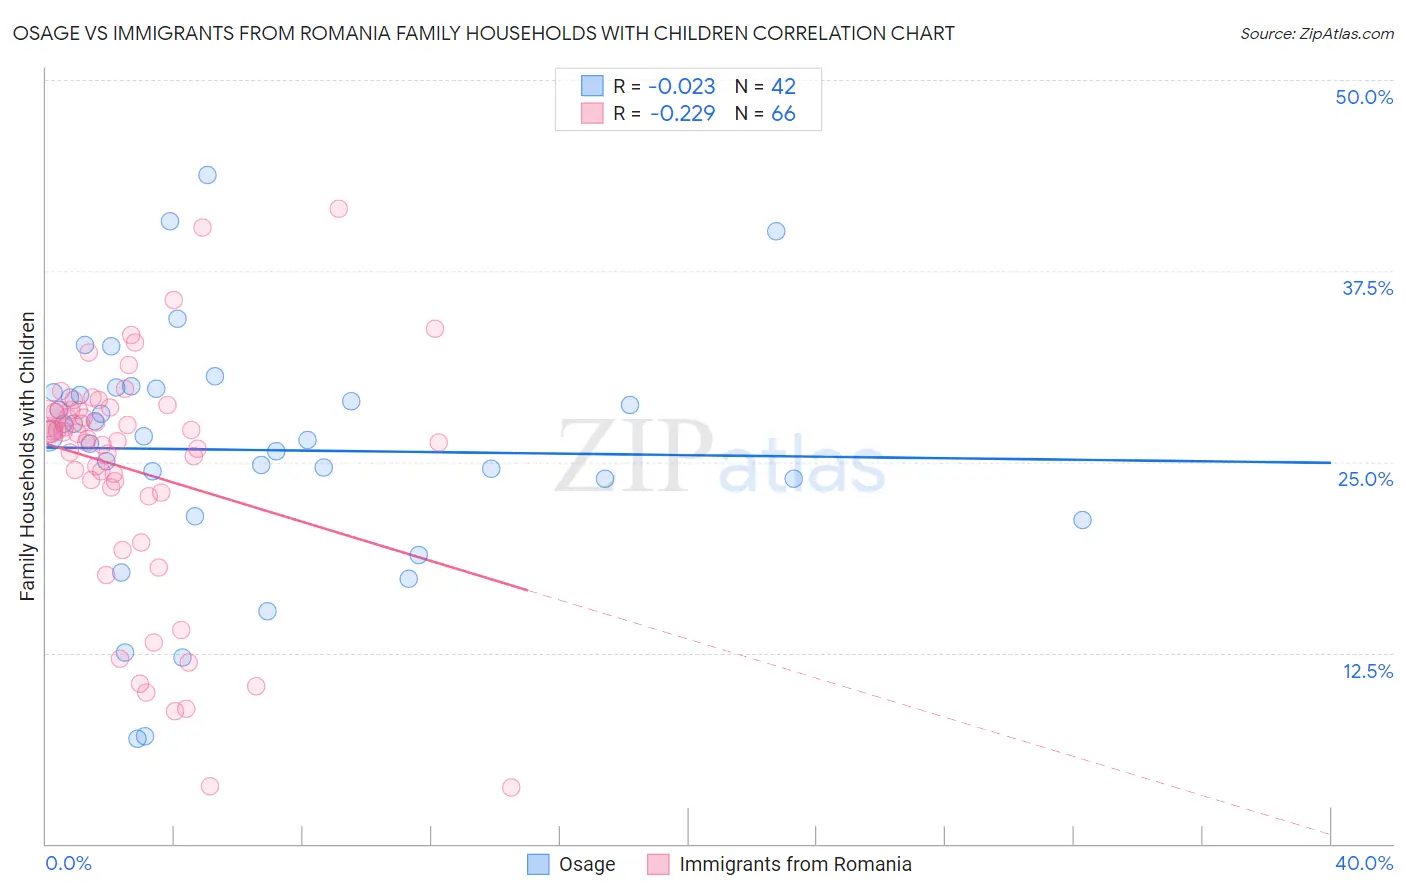
Osage vs Immigrants from Romania Family Households with Children Correlation Chart
The statistical analysis conducted on geographies consisting of 91,796,912 people shows no correlation between the proportion of Osage and percentage of family households with children in the United States with a correlation coefficient (R) of -0.023 and weighted average of 27.6%. Similarly, the statistical analysis conducted on geographies consisting of 256,873,264 people shows a weak negative correlation between the proportion of Immigrants from Romania and percentage of family households with children in the United States with a correlation coefficient (R) of -0.229 and weighted average of 27.4%, a difference of 1.1%.
Family Households with Children Correlation Summary
| Measurement | Osage | Immigrants from Romania |
| Minimum | 6.8% | 3.7% |
| Maximum | 43.8% | 41.5% |
| Range | 36.9% | 37.8% |
| Mean | 25.8% | 24.4% |
| Median | 26.7% | 26.7% |
| Interquartile 25% (IQ1) | 23.9% | 23.0% |
| Interquartile 75% (IQ3) | 29.6% | 28.4% |
| Interquartile Range (IQR) | 5.7% | 5.4% |
| Standard Deviation (Sample) | 7.8% | 7.9% |
| Standard Deviation (Population) | 7.7% | 7.8% |
Similar Demographics by Family Households with Children
Demographics Similar to Osage by Family Households with Children
In terms of family households with children, the demographic groups most similar to Osage are Immigrants from Moldova (27.6%, a difference of 0.0%), Menominee (27.6%, a difference of 0.0%), Brazilian (27.7%, a difference of 0.020%), Immigrants from Chile (27.7%, a difference of 0.020%), and Basque (27.7%, a difference of 0.020%).
| Demographics | Rating | Rank | Family Households with Children |
| Immigrants | Eastern Asia | 81.7 /100 | #141 | Excellent 27.7% |
| Swiss | 81.4 /100 | #142 | Excellent 27.7% |
| Immigrants | Eastern Africa | 80.2 /100 | #143 | Excellent 27.7% |
| Brazilians | 79.6 /100 | #144 | Good 27.7% |
| Immigrants | Chile | 79.5 /100 | #145 | Good 27.7% |
| Basques | 79.5 /100 | #146 | Good 27.7% |
| Immigrants | Moldova | 79.1 /100 | #147 | Good 27.6% |
| Osage | 79.0 /100 | #148 | Good 27.6% |
| Menominee | 78.9 /100 | #149 | Good 27.6% |
| Argentineans | 78.5 /100 | #150 | Good 27.6% |
| Portuguese | 77.8 /100 | #151 | Good 27.6% |
| Ethiopians | 77.0 /100 | #152 | Good 27.6% |
| Immigrants | Cabo Verde | 75.6 /100 | #153 | Good 27.6% |
| Icelanders | 75.3 /100 | #154 | Good 27.6% |
| Comanche | 74.8 /100 | #155 | Good 27.6% |
Demographics Similar to Immigrants from Romania by Family Households with Children
In terms of family households with children, the demographic groups most similar to Immigrants from Romania are Norwegian (27.4%, a difference of 0.010%), Cheyenne (27.4%, a difference of 0.020%), Crow (27.4%, a difference of 0.030%), Immigrants from Iran (27.4%, a difference of 0.040%), and Swedish (27.4%, a difference of 0.060%).
| Demographics | Rating | Rank | Family Households with Children |
| Sudanese | 37.6 /100 | #191 | Fair 27.4% |
| Pennsylvania Germans | 37.5 /100 | #192 | Fair 27.4% |
| Swedes | 36.9 /100 | #193 | Fair 27.4% |
| Immigrants | Iran | 36.1 /100 | #194 | Fair 27.4% |
| Crow | 35.7 /100 | #195 | Fair 27.4% |
| Cheyenne | 35.1 /100 | #196 | Fair 27.4% |
| Norwegians | 35.0 /100 | #197 | Fair 27.4% |
| Immigrants | Romania | 34.4 /100 | #198 | Fair 27.4% |
| English | 32.0 /100 | #199 | Fair 27.3% |
| Immigrants | Congo | 28.7 /100 | #200 | Fair 27.3% |
| Bhutanese | 25.1 /100 | #201 | Fair 27.3% |
| Americans | 22.8 /100 | #202 | Fair 27.3% |
| Kiowa | 22.2 /100 | #203 | Fair 27.3% |
| Immigrants | Sudan | 21.6 /100 | #204 | Fair 27.3% |
| Immigrants | Haiti | 20.3 /100 | #205 | Fair 27.2% |