Immigrants from Zaire vs Immigrants from China Average Family Size
COMPARE
Immigrants from Zaire
Immigrants from China
Average Family Size
Average Family Size Comparison
Immigrants from Zaire
Immigrants from China
3.22
AVERAGE FAMILY SIZE
30.5/ 100
METRIC RATING
191st/ 347
METRIC RANK
3.23
AVERAGE FAMILY SIZE
49.9/ 100
METRIC RATING
175th/ 347
METRIC RANK
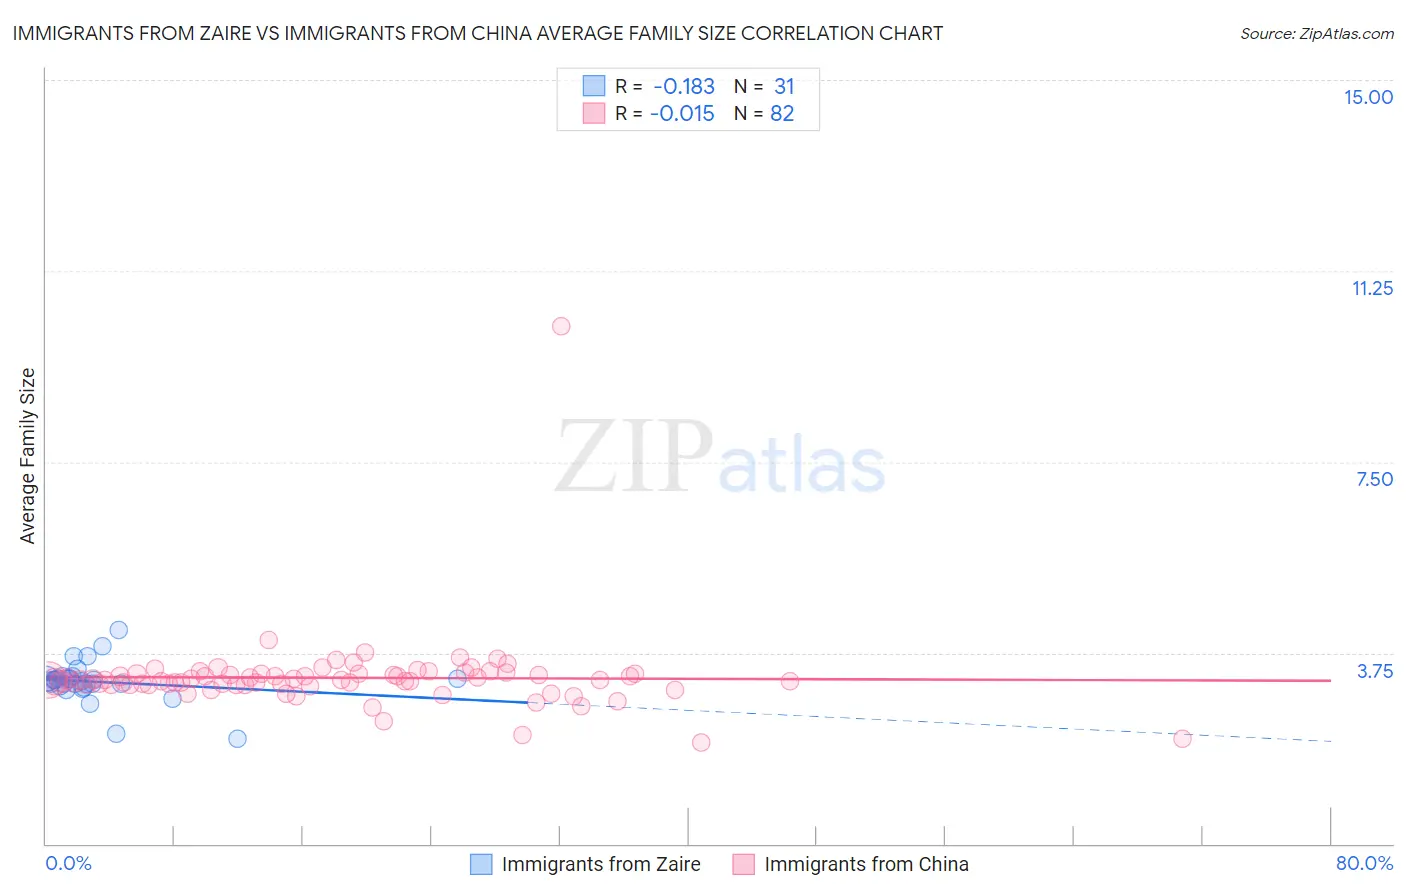
Immigrants from Zaire vs Immigrants from China Average Family Size Correlation Chart
The statistical analysis conducted on geographies consisting of 107,246,225 people shows a poor negative correlation between the proportion of Immigrants from Zaire and average family size in the United States with a correlation coefficient (R) of -0.183 and weighted average of 3.22. Similarly, the statistical analysis conducted on geographies consisting of 456,596,035 people shows no correlation between the proportion of Immigrants from China and average family size in the United States with a correlation coefficient (R) of -0.015 and weighted average of 3.23, a difference of 0.38%.
Average Family Size Correlation Summary
| Measurement | Immigrants from Zaire | Immigrants from China |
| Minimum | 2.06 | 2.00 |
| Maximum | 4.20 | 10.17 |
| Range | 2.14 | 8.17 |
| Mean | 3.18 | 3.26 |
| Median | 3.19 | 3.21 |
| Interquartile 25% (IQ1) | 3.08 | 3.12 |
| Interquartile 75% (IQ3) | 3.25 | 3.33 |
| Interquartile Range (IQR) | 0.17 | 0.21 |
| Standard Deviation (Sample) | 0.40 | 0.84 |
| Standard Deviation (Population) | 0.39 | 0.83 |
Demographics Similar to Immigrants from Zaire and Immigrants from China by Average Family Size
In terms of average family size, the demographic groups most similar to Immigrants from Zaire are Burmese (3.22, a difference of 0.010%), Immigrants from Eastern Africa (3.22, a difference of 0.010%), Immigrants from Israel (3.22, a difference of 0.030%), Pakistani (3.22, a difference of 0.070%), and Thai (3.22, a difference of 0.16%). Similarly, the demographic groups most similar to Immigrants from China are Immigrants from South Central Asia (3.23, a difference of 0.0%), Israeli (3.23, a difference of 0.020%), Immigrants from Uruguay (3.23, a difference of 0.040%), Argentinean (3.23, a difference of 0.050%), and Spaniard (3.23, a difference of 0.050%).
| Demographics | Rating | Rank | Average Family Size |
| Immigrants | Uruguay | 52.0 /100 | #173 | Average 3.23 |
| Immigrants | South Central Asia | 50.0 /100 | #174 | Average 3.23 |
| Immigrants | China | 49.9 /100 | #175 | Average 3.23 |
| Israelis | 48.7 /100 | #176 | Average 3.23 |
| Argentineans | 47.4 /100 | #177 | Average 3.23 |
| Spaniards | 47.2 /100 | #178 | Average 3.23 |
| Immigrants | Korea | 46.9 /100 | #179 | Average 3.23 |
| Palestinians | 46.6 /100 | #180 | Average 3.23 |
| Spanish | 44.8 /100 | #181 | Average 3.23 |
| Moroccans | 44.2 /100 | #182 | Average 3.22 |
| Immigrants | Northern Africa | 41.7 /100 | #183 | Average 3.22 |
| Immigrants | Eastern Asia | 40.8 /100 | #184 | Average 3.22 |
| Immigrants | Sri Lanka | 39.8 /100 | #185 | Fair 3.22 |
| Immigrants | Argentina | 39.8 /100 | #186 | Fair 3.22 |
| Immigrants | Malaysia | 39.0 /100 | #187 | Fair 3.22 |
| Thais | 38.3 /100 | #188 | Fair 3.22 |
| Pakistanis | 33.7 /100 | #189 | Fair 3.22 |
| Burmese | 31.0 /100 | #190 | Fair 3.22 |
| Immigrants | Zaire | 30.5 /100 | #191 | Fair 3.22 |
| Immigrants | Eastern Africa | 30.1 /100 | #192 | Fair 3.22 |
| Immigrants | Israel | 29.3 /100 | #193 | Fair 3.22 |