Immigrants from Colombia vs Dutch Currently Married
COMPARE
Immigrants from Colombia
Dutch
Currently Married
Currently Married Comparison
Immigrants from Colombia
Dutch
46.1%
CURRENTLY MARRIED
21.0/ 100
METRIC RATING
198th/ 347
METRIC RANK
49.6%
CURRENTLY MARRIED
99.9/ 100
METRIC RATING
13th/ 347
METRIC RANK
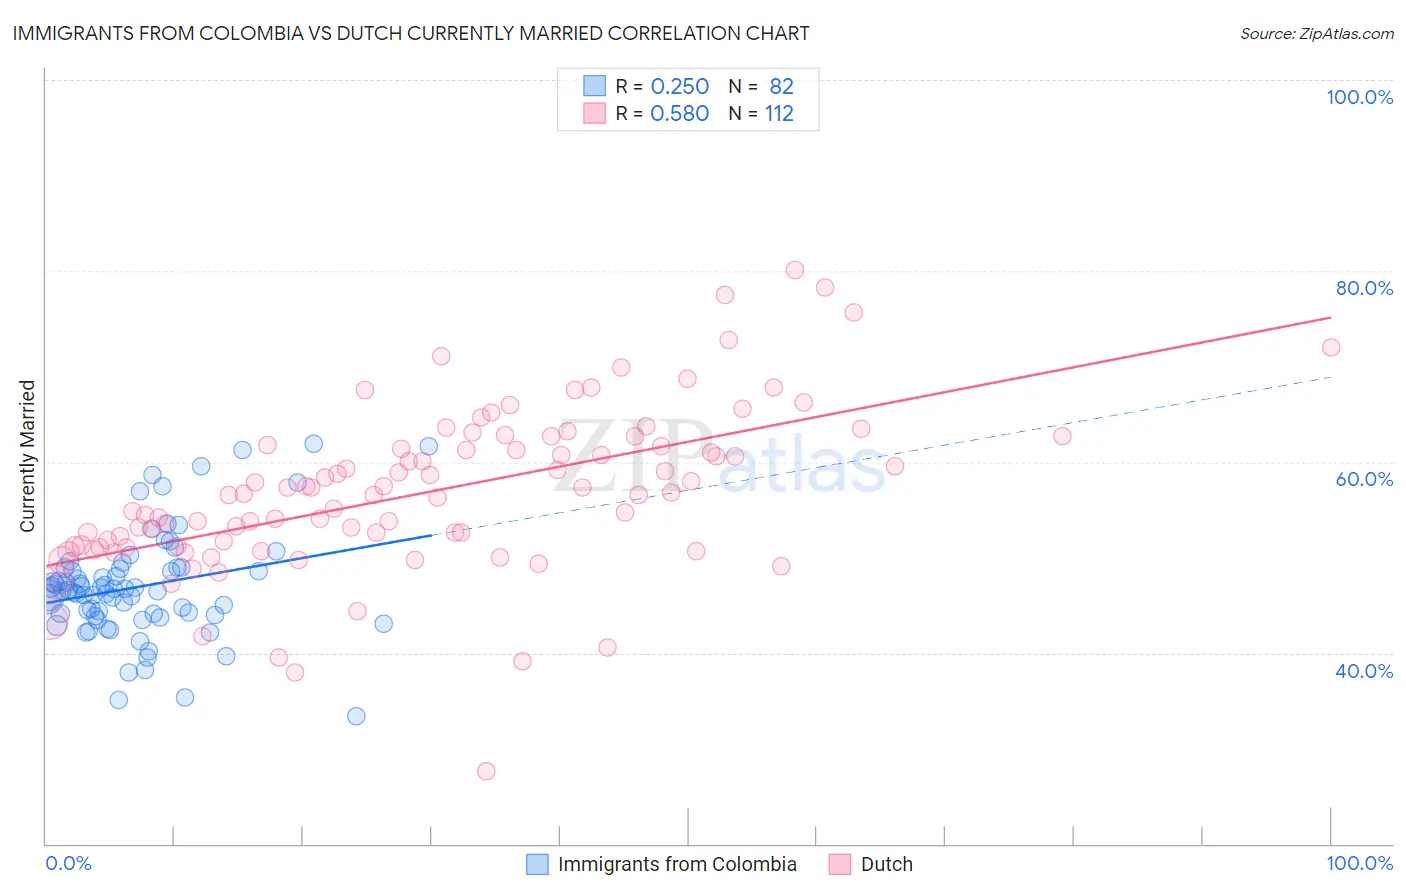
Immigrants from Colombia vs Dutch Currently Married Correlation Chart
The statistical analysis conducted on geographies consisting of 378,670,909 people shows a weak positive correlation between the proportion of Immigrants from Colombia and percentage of population currently married in the United States with a correlation coefficient (R) of 0.250 and weighted average of 46.1%. Similarly, the statistical analysis conducted on geographies consisting of 554,255,721 people shows a substantial positive correlation between the proportion of Dutch and percentage of population currently married in the United States with a correlation coefficient (R) of 0.580 and weighted average of 49.6%, a difference of 7.6%.
Currently Married Correlation Summary
| Measurement | Immigrants from Colombia | Dutch |
| Minimum | 33.3% | 27.6% |
| Maximum | 61.9% | 80.1% |
| Range | 28.6% | 52.5% |
| Mean | 47.0% | 56.8% |
| Median | 46.5% | 56.6% |
| Interquartile 25% (IQ1) | 44.0% | 51.2% |
| Interquartile 75% (IQ3) | 48.9% | 61.7% |
| Interquartile Range (IQR) | 4.9% | 10.6% |
| Standard Deviation (Sample) | 5.6% | 8.6% |
| Standard Deviation (Population) | 5.6% | 8.6% |
Similar Demographics by Currently Married
Demographics Similar to Immigrants from Colombia by Currently Married
In terms of currently married, the demographic groups most similar to Immigrants from Colombia are Immigrants from Kuwait (46.1%, a difference of 0.040%), Immigrants from Bosnia and Herzegovina (46.1%, a difference of 0.070%), Immigrants from Costa Rica (46.0%, a difference of 0.080%), Immigrants from Nepal (46.1%, a difference of 0.14%), and South American (46.1%, a difference of 0.15%).
| Demographics | Rating | Rank | Currently Married |
| Immigrants | France | 27.7 /100 | #191 | Fair 46.2% |
| Soviet Union | 25.7 /100 | #192 | Fair 46.2% |
| Immigrants | Fiji | 25.0 /100 | #193 | Fair 46.2% |
| South Americans | 23.8 /100 | #194 | Fair 46.1% |
| Immigrants | Nepal | 23.7 /100 | #195 | Fair 46.1% |
| Immigrants | Bosnia and Herzegovina | 22.2 /100 | #196 | Fair 46.1% |
| Immigrants | Kuwait | 21.7 /100 | #197 | Fair 46.1% |
| Immigrants | Colombia | 21.0 /100 | #198 | Fair 46.1% |
| Immigrants | Costa Rica | 19.6 /100 | #199 | Poor 46.0% |
| Creek | 17.2 /100 | #200 | Poor 46.0% |
| Malaysians | 15.3 /100 | #201 | Poor 45.9% |
| Immigrants | Albania | 14.5 /100 | #202 | Poor 45.9% |
| Taiwanese | 11.7 /100 | #203 | Poor 45.8% |
| Immigrants | Spain | 11.6 /100 | #204 | Poor 45.8% |
| South American Indians | 11.5 /100 | #205 | Poor 45.8% |
Demographics Similar to Dutch by Currently Married
In terms of currently married, the demographic groups most similar to Dutch are German (49.6%, a difference of 0.010%), Pennsylvania German (49.6%, a difference of 0.040%), Chinese (49.5%, a difference of 0.18%), Scandinavian (49.5%, a difference of 0.20%), and English (49.7%, a difference of 0.26%).
| Demographics | Rating | Rank | Currently Married |
| Norwegians | 100.0 /100 | #6 | Exceptional 50.2% |
| Immigrants | South Central Asia | 100.0 /100 | #7 | Exceptional 50.0% |
| Swedes | 100.0 /100 | #8 | Exceptional 50.0% |
| Czechs | 99.9 /100 | #9 | Exceptional 49.9% |
| Filipinos | 99.9 /100 | #10 | Exceptional 49.7% |
| English | 99.9 /100 | #11 | Exceptional 49.7% |
| Swiss | 99.9 /100 | #12 | Exceptional 49.7% |
| Dutch | 99.9 /100 | #13 | Exceptional 49.6% |
| Germans | 99.9 /100 | #14 | Exceptional 49.6% |
| Pennsylvania Germans | 99.9 /100 | #15 | Exceptional 49.6% |
| Chinese | 99.9 /100 | #16 | Exceptional 49.5% |
| Scandinavians | 99.9 /100 | #17 | Exceptional 49.5% |
| Immigrants | Scotland | 99.8 /100 | #18 | Exceptional 49.3% |
| Europeans | 99.8 /100 | #19 | Exceptional 49.3% |
| Luxembourgers | 99.8 /100 | #20 | Exceptional 49.3% |