Immigrants from Colombia vs Immigrants from Serbia Single Mother Households
COMPARE
Immigrants from Colombia
Immigrants from Serbia
Single Mother Households
Single Mother Households Comparison
Immigrants from Colombia
Immigrants from Serbia
6.7%
SINGLE MOTHER HOUSEHOLDS
10.5/ 100
METRIC RATING
209th/ 347
METRIC RANK
5.4%
SINGLE MOTHER HOUSEHOLDS
99.6/ 100
METRIC RATING
38th/ 347
METRIC RANK
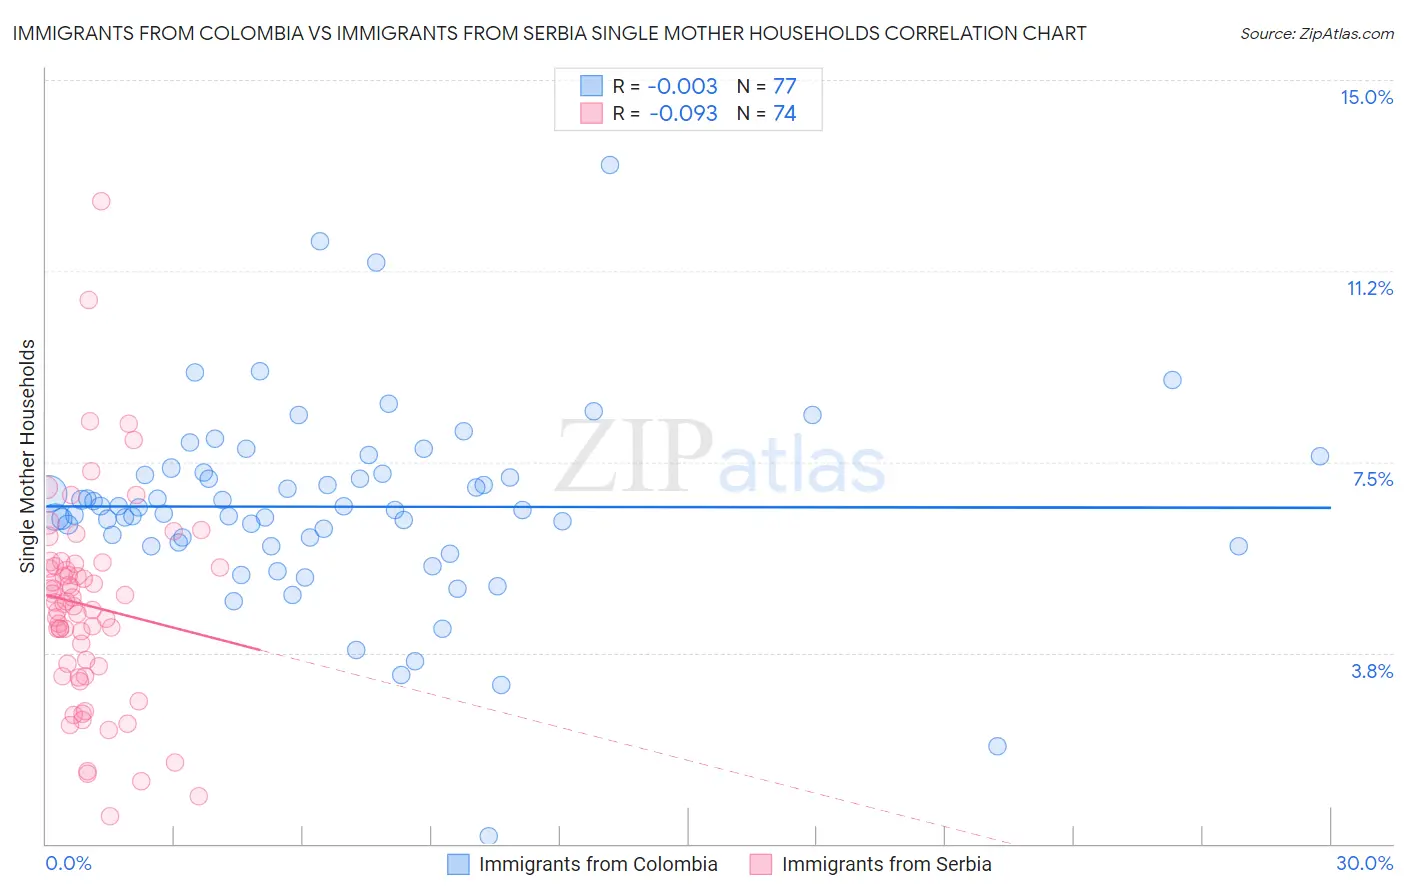
Immigrants from Colombia vs Immigrants from Serbia Single Mother Households Correlation Chart
The statistical analysis conducted on geographies consisting of 377,860,755 people shows no correlation between the proportion of Immigrants from Colombia and percentage of single mother households in the United States with a correlation coefficient (R) of -0.003 and weighted average of 6.7%. Similarly, the statistical analysis conducted on geographies consisting of 131,621,048 people shows a slight negative correlation between the proportion of Immigrants from Serbia and percentage of single mother households in the United States with a correlation coefficient (R) of -0.093 and weighted average of 5.4%, a difference of 24.8%.
Single Mother Households Correlation Summary
| Measurement | Immigrants from Colombia | Immigrants from Serbia |
| Minimum | 0.15% | 0.54% |
| Maximum | 13.3% | 12.6% |
| Range | 13.2% | 12.1% |
| Mean | 6.6% | 4.7% |
| Median | 6.6% | 4.7% |
| Interquartile 25% (IQ1) | 5.9% | 3.5% |
| Interquartile 75% (IQ3) | 7.3% | 5.4% |
| Interquartile Range (IQR) | 1.4% | 2.0% |
| Standard Deviation (Sample) | 1.9% | 2.0% |
| Standard Deviation (Population) | 1.9% | 2.0% |
Similar Demographics by Single Mother Households
Demographics Similar to Immigrants from Colombia by Single Mother Households
In terms of single mother households, the demographic groups most similar to Immigrants from Colombia are Nonimmigrants (6.7%, a difference of 0.020%), Vietnamese (6.7%, a difference of 0.21%), German Russian (6.7%, a difference of 0.27%), Immigrants from South America (6.7%, a difference of 0.27%), and Cree (6.7%, a difference of 0.35%).
| Demographics | Rating | Rank | Single Mother Households |
| Guamanians/Chamorros | 12.4 /100 | #202 | Poor 6.6% |
| Immigrants | Peru | 12.0 /100 | #203 | Poor 6.7% |
| Immigrants | Fiji | 11.9 /100 | #204 | Poor 6.7% |
| Cree | 11.9 /100 | #205 | Poor 6.7% |
| German Russians | 11.5 /100 | #206 | Poor 6.7% |
| Immigrants | South America | 11.5 /100 | #207 | Poor 6.7% |
| Vietnamese | 11.3 /100 | #208 | Poor 6.7% |
| Immigrants | Colombia | 10.5 /100 | #209 | Poor 6.7% |
| Immigrants | Nonimmigrants | 10.4 /100 | #210 | Poor 6.7% |
| Immigrants | Venezuela | 8.5 /100 | #211 | Tragic 6.7% |
| Immigrants | Eritrea | 8.4 /100 | #212 | Tragic 6.7% |
| Immigrants | Costa Rica | 8.2 /100 | #213 | Tragic 6.7% |
| Immigrants | Uruguay | 7.9 /100 | #214 | Tragic 6.7% |
| Shoshone | 5.7 /100 | #215 | Tragic 6.8% |
| Cherokee | 5.1 /100 | #216 | Tragic 6.8% |
Demographics Similar to Immigrants from Serbia by Single Mother Households
In terms of single mother households, the demographic groups most similar to Immigrants from Serbia are Immigrants from Sweden (5.4%, a difference of 0.14%), Estonian (5.4%, a difference of 0.25%), Immigrants from Belgium (5.3%, a difference of 0.43%), Immigrants from Czechoslovakia (5.3%, a difference of 0.58%), and Immigrants from Greece (5.4%, a difference of 0.67%).
| Demographics | Rating | Rank | Single Mother Households |
| Immigrants | Korea | 99.7 /100 | #31 | Exceptional 5.3% |
| Cambodians | 99.7 /100 | #32 | Exceptional 5.3% |
| Immigrants | Switzerland | 99.7 /100 | #33 | Exceptional 5.3% |
| Bulgarians | 99.7 /100 | #34 | Exceptional 5.3% |
| Immigrants | Northern Europe | 99.7 /100 | #35 | Exceptional 5.3% |
| Immigrants | Czechoslovakia | 99.7 /100 | #36 | Exceptional 5.3% |
| Immigrants | Belgium | 99.7 /100 | #37 | Exceptional 5.3% |
| Immigrants | Serbia | 99.6 /100 | #38 | Exceptional 5.4% |
| Immigrants | Sweden | 99.6 /100 | #39 | Exceptional 5.4% |
| Estonians | 99.6 /100 | #40 | Exceptional 5.4% |
| Immigrants | Greece | 99.5 /100 | #41 | Exceptional 5.4% |
| Macedonians | 99.5 /100 | #42 | Exceptional 5.4% |
| Immigrants | South Central Asia | 99.5 /100 | #43 | Exceptional 5.4% |
| Lithuanians | 99.4 /100 | #44 | Exceptional 5.4% |
| Immigrants | Croatia | 99.4 /100 | #45 | Exceptional 5.4% |