Immigrants from Colombia vs Immigrants from South Africa Births to Unmarried Women
COMPARE
Immigrants from Colombia
Immigrants from South Africa
Births to Unmarried Women
Births to Unmarried Women Comparison
Immigrants from Colombia
Immigrants from South Africa
32.6%
BIRTHS TO UNMARRIED WOMEN
21.7/ 100
METRIC RATING
196th/ 347
METRIC RANK
29.3%
BIRTHS TO UNMARRIED WOMEN
95.7/ 100
METRIC RATING
97th/ 347
METRIC RANK
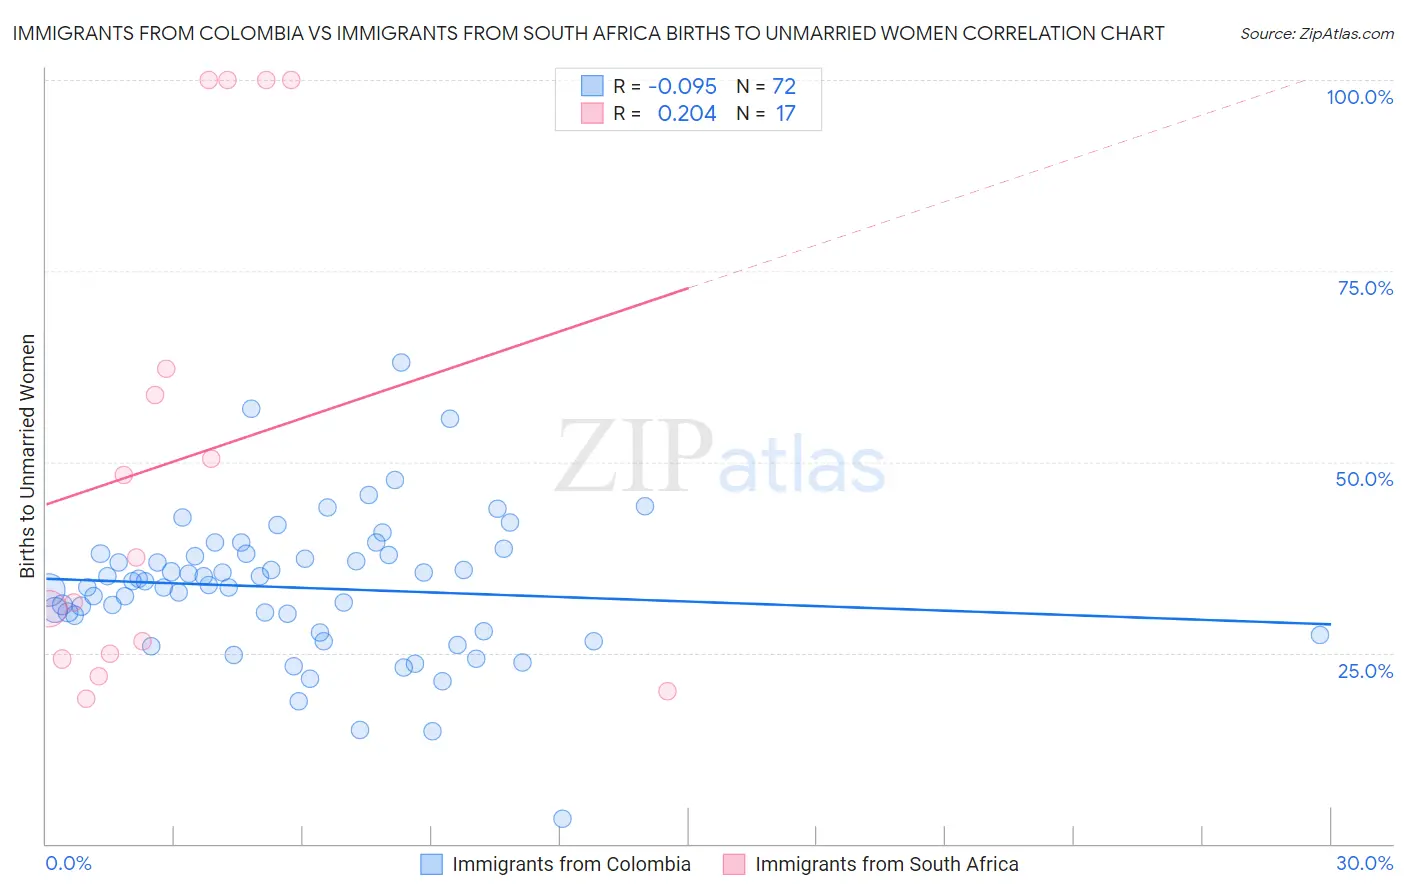
Immigrants from Colombia vs Immigrants from South Africa Births to Unmarried Women Correlation Chart
The statistical analysis conducted on geographies consisting of 355,596,332 people shows a slight negative correlation between the proportion of Immigrants from Colombia and percentage of births to unmarried women in the United States with a correlation coefficient (R) of -0.095 and weighted average of 32.6%. Similarly, the statistical analysis conducted on geographies consisting of 219,322,992 people shows a weak positive correlation between the proportion of Immigrants from South Africa and percentage of births to unmarried women in the United States with a correlation coefficient (R) of 0.204 and weighted average of 29.3%, a difference of 11.2%.
Births to Unmarried Women Correlation Summary
| Measurement | Immigrants from Colombia | Immigrants from South Africa |
| Minimum | 3.3% | 19.0% |
| Maximum | 63.1% | 100.0% |
| Range | 59.8% | 81.0% |
| Mean | 33.5% | 50.4% |
| Median | 34.1% | 37.5% |
| Interquartile 25% (IQ1) | 27.8% | 24.5% |
| Interquartile 75% (IQ3) | 37.9% | 81.1% |
| Interquartile Range (IQR) | 10.1% | 56.6% |
| Standard Deviation (Sample) | 9.4% | 31.2% |
| Standard Deviation (Population) | 9.3% | 30.3% |
Similar Demographics by Births to Unmarried Women
Demographics Similar to Immigrants from Colombia by Births to Unmarried Women
In terms of births to unmarried women, the demographic groups most similar to Immigrants from Colombia are Samoan (32.6%, a difference of 0.030%), Immigrants (32.7%, a difference of 0.15%), Costa Rican (32.7%, a difference of 0.20%), Immigrants from Thailand (32.8%, a difference of 0.40%), and Immigrants from Germany (32.8%, a difference of 0.42%).
| Demographics | Rating | Rank | Births to Unmarried Women |
| Immigrants | Kenya | 36.9 /100 | #189 | Fair 32.1% |
| Tlingit-Haida | 32.6 /100 | #190 | Fair 32.2% |
| Irish | 32.4 /100 | #191 | Fair 32.2% |
| Colombians | 31.9 /100 | #192 | Fair 32.2% |
| Fijians | 31.1 /100 | #193 | Fair 32.3% |
| Sudanese | 27.3 /100 | #194 | Fair 32.4% |
| Samoans | 21.9 /100 | #195 | Fair 32.6% |
| Immigrants | Colombia | 21.7 /100 | #196 | Fair 32.6% |
| Immigrants | Immigrants | 20.6 /100 | #197 | Fair 32.7% |
| Costa Ricans | 20.3 /100 | #198 | Fair 32.7% |
| Immigrants | Thailand | 18.9 /100 | #199 | Poor 32.8% |
| Immigrants | Germany | 18.8 /100 | #200 | Poor 32.8% |
| Immigrants | Burma/Myanmar | 16.7 /100 | #201 | Poor 32.9% |
| Immigrants | Micronesia | 16.6 /100 | #202 | Poor 32.9% |
| Ute | 14.4 /100 | #203 | Poor 33.0% |
Demographics Similar to Immigrants from South Africa by Births to Unmarried Women
In terms of births to unmarried women, the demographic groups most similar to Immigrants from South Africa are Immigrants from Syria (29.4%, a difference of 0.020%), Norwegian (29.3%, a difference of 0.040%), Immigrants from Denmark (29.4%, a difference of 0.26%), Luxembourger (29.4%, a difference of 0.26%), and Immigrants from Vietnam (29.3%, a difference of 0.27%).
| Demographics | Rating | Rank | Births to Unmarried Women |
| Immigrants | Latvia | 96.8 /100 | #90 | Exceptional 29.1% |
| Immigrants | Fiji | 96.6 /100 | #91 | Exceptional 29.2% |
| Arabs | 96.5 /100 | #92 | Exceptional 29.2% |
| Estonians | 96.5 /100 | #93 | Exceptional 29.2% |
| Ukrainians | 96.3 /100 | #94 | Exceptional 29.2% |
| Immigrants | Vietnam | 96.1 /100 | #95 | Exceptional 29.3% |
| Norwegians | 95.8 /100 | #96 | Exceptional 29.3% |
| Immigrants | South Africa | 95.7 /100 | #97 | Exceptional 29.3% |
| Immigrants | Syria | 95.7 /100 | #98 | Exceptional 29.4% |
| Immigrants | Denmark | 95.3 /100 | #99 | Exceptional 29.4% |
| Luxembourgers | 95.2 /100 | #100 | Exceptional 29.4% |
| Immigrants | Northern Africa | 94.7 /100 | #101 | Exceptional 29.5% |
| Australians | 94.6 /100 | #102 | Exceptional 29.5% |
| Lebanese | 94.4 /100 | #103 | Exceptional 29.5% |
| Lithuanians | 94.4 /100 | #104 | Exceptional 29.6% |