Immigrants from Colombia vs Cambodian Births to Unmarried Women
COMPARE
Immigrants from Colombia
Cambodian
Births to Unmarried Women
Births to Unmarried Women Comparison
Immigrants from Colombia
Cambodians
32.6%
BIRTHS TO UNMARRIED WOMEN
21.7/ 100
METRIC RATING
196th/ 347
METRIC RANK
26.7%
BIRTHS TO UNMARRIED WOMEN
99.9/ 100
METRIC RATING
25th/ 347
METRIC RANK
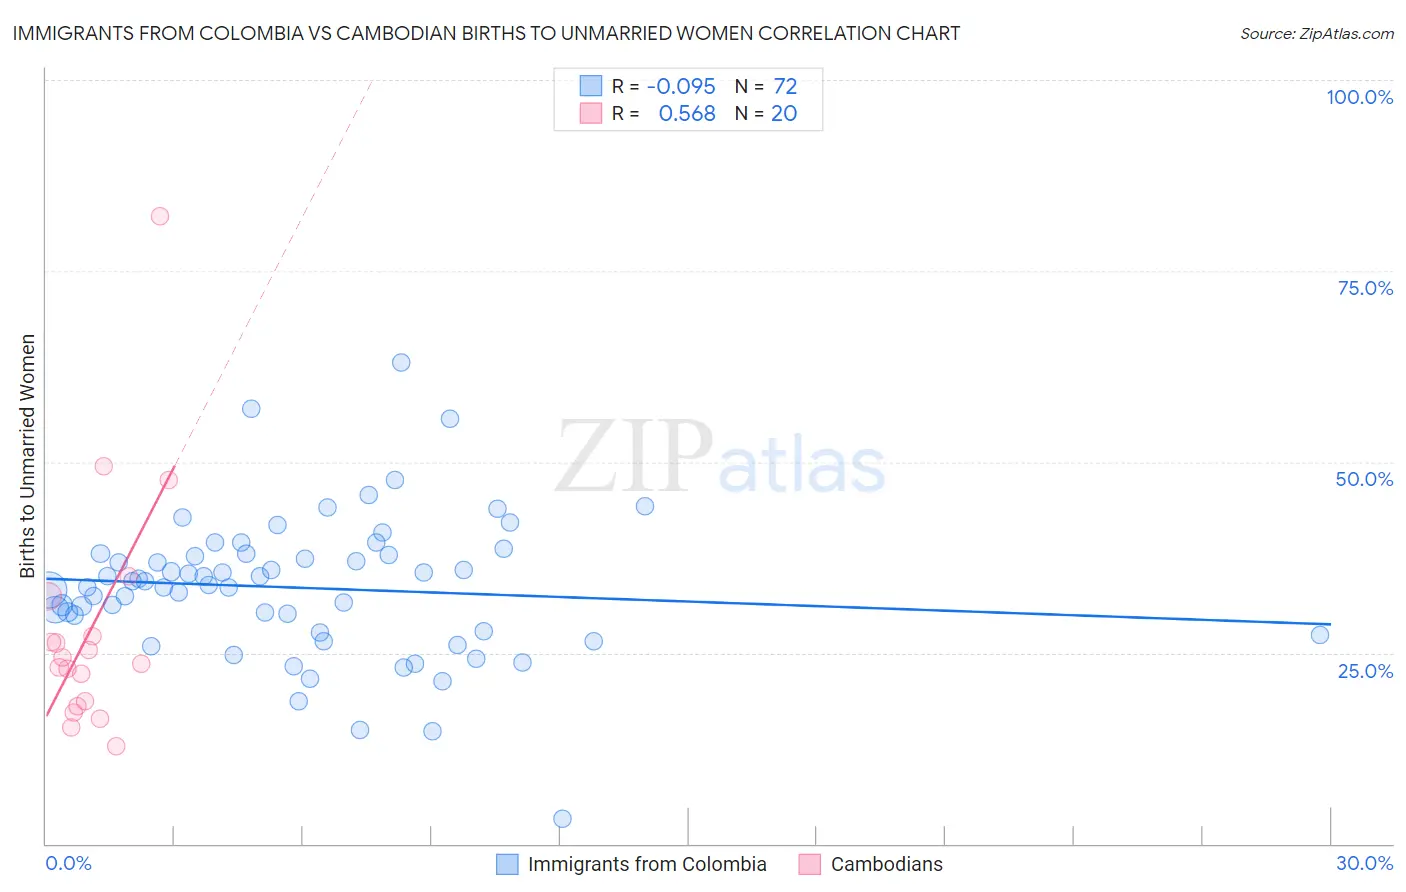
Immigrants from Colombia vs Cambodian Births to Unmarried Women Correlation Chart
The statistical analysis conducted on geographies consisting of 355,596,332 people shows a slight negative correlation between the proportion of Immigrants from Colombia and percentage of births to unmarried women in the United States with a correlation coefficient (R) of -0.095 and weighted average of 32.6%. Similarly, the statistical analysis conducted on geographies consisting of 99,884,010 people shows a substantial positive correlation between the proportion of Cambodians and percentage of births to unmarried women in the United States with a correlation coefficient (R) of 0.568 and weighted average of 26.7%, a difference of 22.3%.
Births to Unmarried Women Correlation Summary
| Measurement | Immigrants from Colombia | Cambodian |
| Minimum | 3.3% | 12.7% |
| Maximum | 63.1% | 82.1% |
| Range | 59.8% | 69.4% |
| Mean | 33.5% | 28.3% |
| Median | 34.1% | 23.9% |
| Interquartile 25% (IQ1) | 27.8% | 18.4% |
| Interquartile 75% (IQ3) | 37.9% | 29.7% |
| Interquartile Range (IQR) | 10.1% | 11.3% |
| Standard Deviation (Sample) | 9.4% | 15.9% |
| Standard Deviation (Population) | 9.3% | 15.5% |
Similar Demographics by Births to Unmarried Women
Demographics Similar to Immigrants from Colombia by Births to Unmarried Women
In terms of births to unmarried women, the demographic groups most similar to Immigrants from Colombia are Samoan (32.6%, a difference of 0.030%), Immigrants (32.7%, a difference of 0.15%), Costa Rican (32.7%, a difference of 0.20%), Immigrants from Thailand (32.8%, a difference of 0.40%), and Immigrants from Germany (32.8%, a difference of 0.42%).
| Demographics | Rating | Rank | Births to Unmarried Women |
| Immigrants | Kenya | 36.9 /100 | #189 | Fair 32.1% |
| Tlingit-Haida | 32.6 /100 | #190 | Fair 32.2% |
| Irish | 32.4 /100 | #191 | Fair 32.2% |
| Colombians | 31.9 /100 | #192 | Fair 32.2% |
| Fijians | 31.1 /100 | #193 | Fair 32.3% |
| Sudanese | 27.3 /100 | #194 | Fair 32.4% |
| Samoans | 21.9 /100 | #195 | Fair 32.6% |
| Immigrants | Colombia | 21.7 /100 | #196 | Fair 32.6% |
| Immigrants | Immigrants | 20.6 /100 | #197 | Fair 32.7% |
| Costa Ricans | 20.3 /100 | #198 | Fair 32.7% |
| Immigrants | Thailand | 18.9 /100 | #199 | Poor 32.8% |
| Immigrants | Germany | 18.8 /100 | #200 | Poor 32.8% |
| Immigrants | Burma/Myanmar | 16.7 /100 | #201 | Poor 32.9% |
| Immigrants | Micronesia | 16.6 /100 | #202 | Poor 32.9% |
| Ute | 14.4 /100 | #203 | Poor 33.0% |
Demographics Similar to Cambodians by Births to Unmarried Women
In terms of births to unmarried women, the demographic groups most similar to Cambodians are Immigrants from Australia (26.6%, a difference of 0.21%), Asian (26.8%, a difference of 0.39%), Immigrants from Asia (26.8%, a difference of 0.40%), Okinawan (26.9%, a difference of 0.91%), and Immigrants from Japan (26.4%, a difference of 1.0%).
| Demographics | Rating | Rank | Births to Unmarried Women |
| Immigrants | Armenia | 99.9 /100 | #18 | Exceptional 26.1% |
| Armenians | 99.9 /100 | #19 | Exceptional 26.2% |
| Immigrants | Korea | 99.9 /100 | #20 | Exceptional 26.3% |
| Soviet Union | 99.9 /100 | #21 | Exceptional 26.3% |
| Burmese | 99.9 /100 | #22 | Exceptional 26.4% |
| Immigrants | Japan | 99.9 /100 | #23 | Exceptional 26.4% |
| Immigrants | Australia | 99.9 /100 | #24 | Exceptional 26.6% |
| Cambodians | 99.9 /100 | #25 | Exceptional 26.7% |
| Asians | 99.9 /100 | #26 | Exceptional 26.8% |
| Immigrants | Asia | 99.9 /100 | #27 | Exceptional 26.8% |
| Okinawans | 99.8 /100 | #28 | Exceptional 26.9% |
| Cypriots | 99.8 /100 | #29 | Exceptional 27.0% |
| Bulgarians | 99.8 /100 | #30 | Exceptional 27.1% |
| Immigrants | Iraq | 99.8 /100 | #31 | Exceptional 27.1% |
| Immigrants | Russia | 99.8 /100 | #32 | Exceptional 27.1% |