Immigrants from Colombia vs Immigrants from Western Asia Births to Unmarried Women
COMPARE
Immigrants from Colombia
Immigrants from Western Asia
Births to Unmarried Women
Births to Unmarried Women Comparison
Immigrants from Colombia
Immigrants from Western Asia
32.6%
BIRTHS TO UNMARRIED WOMEN
21.7/ 100
METRIC RATING
196th/ 347
METRIC RANK
27.2%
BIRTHS TO UNMARRIED WOMEN
99.7/ 100
METRIC RATING
36th/ 347
METRIC RANK
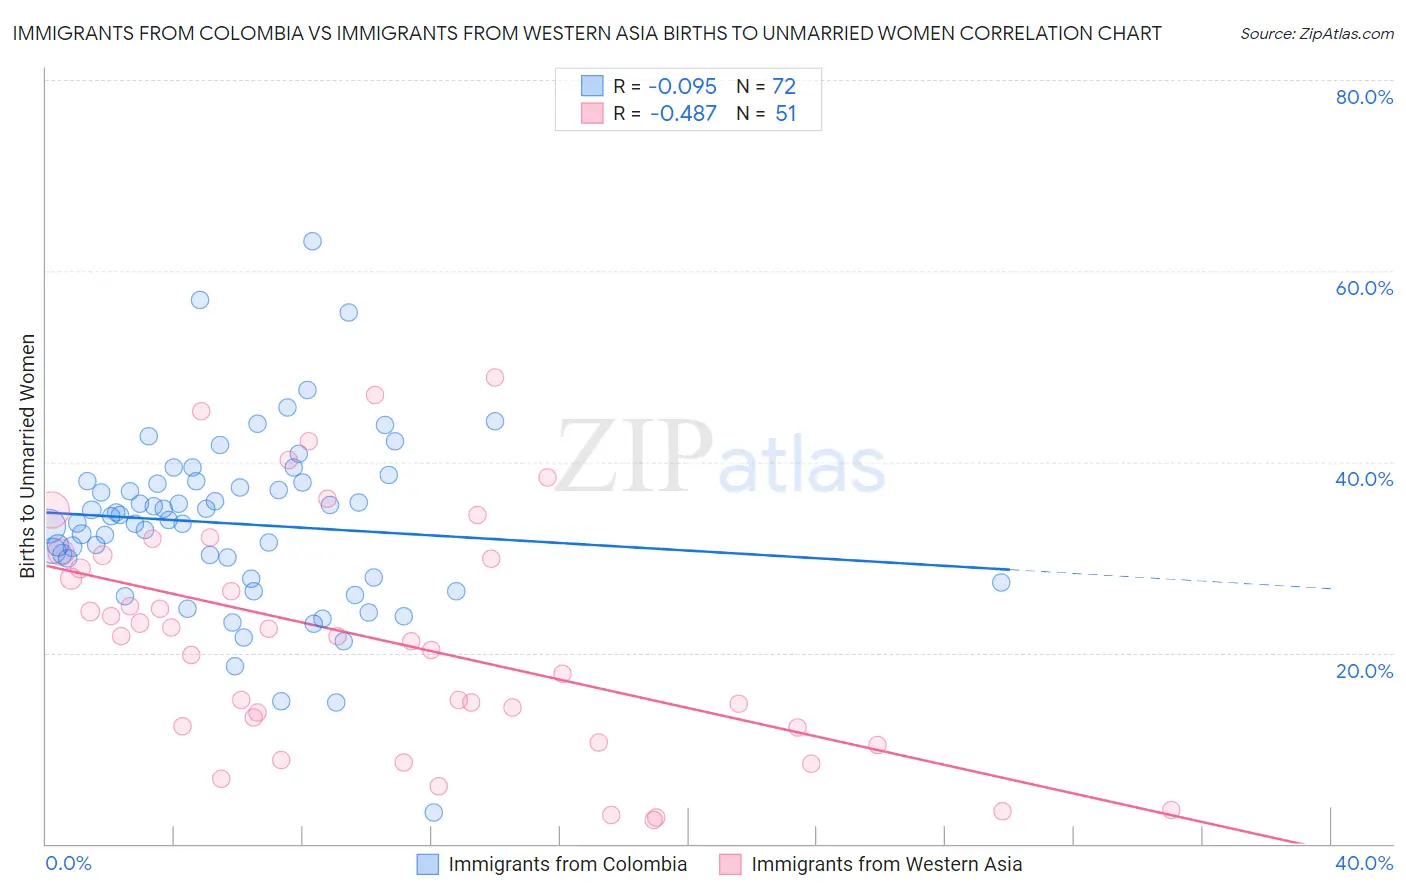
Immigrants from Colombia vs Immigrants from Western Asia Births to Unmarried Women Correlation Chart
The statistical analysis conducted on geographies consisting of 355,596,332 people shows a slight negative correlation between the proportion of Immigrants from Colombia and percentage of births to unmarried women in the United States with a correlation coefficient (R) of -0.095 and weighted average of 32.6%. Similarly, the statistical analysis conducted on geographies consisting of 375,849,187 people shows a moderate negative correlation between the proportion of Immigrants from Western Asia and percentage of births to unmarried women in the United States with a correlation coefficient (R) of -0.487 and weighted average of 27.2%, a difference of 19.9%.
Births to Unmarried Women Correlation Summary
| Measurement | Immigrants from Colombia | Immigrants from Western Asia |
| Minimum | 3.3% | 2.5% |
| Maximum | 63.1% | 48.9% |
| Range | 59.8% | 46.4% |
| Mean | 33.5% | 21.4% |
| Median | 34.1% | 21.7% |
| Interquartile 25% (IQ1) | 27.8% | 12.1% |
| Interquartile 75% (IQ3) | 37.9% | 30.2% |
| Interquartile Range (IQR) | 10.1% | 18.1% |
| Standard Deviation (Sample) | 9.4% | 12.4% |
| Standard Deviation (Population) | 9.3% | 12.2% |
Similar Demographics by Births to Unmarried Women
Demographics Similar to Immigrants from Colombia by Births to Unmarried Women
In terms of births to unmarried women, the demographic groups most similar to Immigrants from Colombia are Samoan (32.6%, a difference of 0.030%), Immigrants (32.7%, a difference of 0.15%), Costa Rican (32.7%, a difference of 0.20%), Immigrants from Thailand (32.8%, a difference of 0.40%), and Immigrants from Germany (32.8%, a difference of 0.42%).
| Demographics | Rating | Rank | Births to Unmarried Women |
| Immigrants | Kenya | 36.9 /100 | #189 | Fair 32.1% |
| Tlingit-Haida | 32.6 /100 | #190 | Fair 32.2% |
| Irish | 32.4 /100 | #191 | Fair 32.2% |
| Colombians | 31.9 /100 | #192 | Fair 32.2% |
| Fijians | 31.1 /100 | #193 | Fair 32.3% |
| Sudanese | 27.3 /100 | #194 | Fair 32.4% |
| Samoans | 21.9 /100 | #195 | Fair 32.6% |
| Immigrants | Colombia | 21.7 /100 | #196 | Fair 32.6% |
| Immigrants | Immigrants | 20.6 /100 | #197 | Fair 32.7% |
| Costa Ricans | 20.3 /100 | #198 | Fair 32.7% |
| Immigrants | Thailand | 18.9 /100 | #199 | Poor 32.8% |
| Immigrants | Germany | 18.8 /100 | #200 | Poor 32.8% |
| Immigrants | Burma/Myanmar | 16.7 /100 | #201 | Poor 32.9% |
| Immigrants | Micronesia | 16.6 /100 | #202 | Poor 32.9% |
| Ute | 14.4 /100 | #203 | Poor 33.0% |
Demographics Similar to Immigrants from Western Asia by Births to Unmarried Women
In terms of births to unmarried women, the demographic groups most similar to Immigrants from Western Asia are Immigrants from Ireland (27.2%, a difference of 0.070%), Immigrants from Ukraine (27.2%, a difference of 0.090%), Immigrants from Pakistan (27.2%, a difference of 0.15%), Immigrants from Sri Lanka (27.2%, a difference of 0.19%), and Immigrants from Moldova (27.3%, a difference of 0.23%).
| Demographics | Rating | Rank | Births to Unmarried Women |
| Cypriots | 99.8 /100 | #29 | Exceptional 27.0% |
| Bulgarians | 99.8 /100 | #30 | Exceptional 27.1% |
| Immigrants | Iraq | 99.8 /100 | #31 | Exceptional 27.1% |
| Immigrants | Russia | 99.8 /100 | #32 | Exceptional 27.1% |
| Immigrants | Sri Lanka | 99.8 /100 | #33 | Exceptional 27.2% |
| Immigrants | Pakistan | 99.8 /100 | #34 | Exceptional 27.2% |
| Immigrants | Ireland | 99.7 /100 | #35 | Exceptional 27.2% |
| Immigrants | Western Asia | 99.7 /100 | #36 | Exceptional 27.2% |
| Immigrants | Ukraine | 99.7 /100 | #37 | Exceptional 27.2% |
| Immigrants | Moldova | 99.7 /100 | #38 | Exceptional 27.3% |
| Immigrants | Malaysia | 99.7 /100 | #39 | Exceptional 27.4% |
| Turks | 99.6 /100 | #40 | Exceptional 27.4% |
| Iraqis | 99.6 /100 | #41 | Exceptional 27.6% |
| Immigrants | Eastern Europe | 99.6 /100 | #42 | Exceptional 27.6% |
| Immigrants | Bulgaria | 99.6 /100 | #43 | Exceptional 27.6% |