Immigrants from China vs Portuguese Doctorate Degree
COMPARE
Immigrants from China
Portuguese
Doctorate Degree
Doctorate Degree Comparison
Immigrants from China
Portuguese
3.1%
DOCTORATE DEGREE
100.0/ 100
METRIC RATING
7th/ 347
METRIC RANK
1.8%
DOCTORATE DEGREE
21.4/ 100
METRIC RATING
202nd/ 347
METRIC RANK
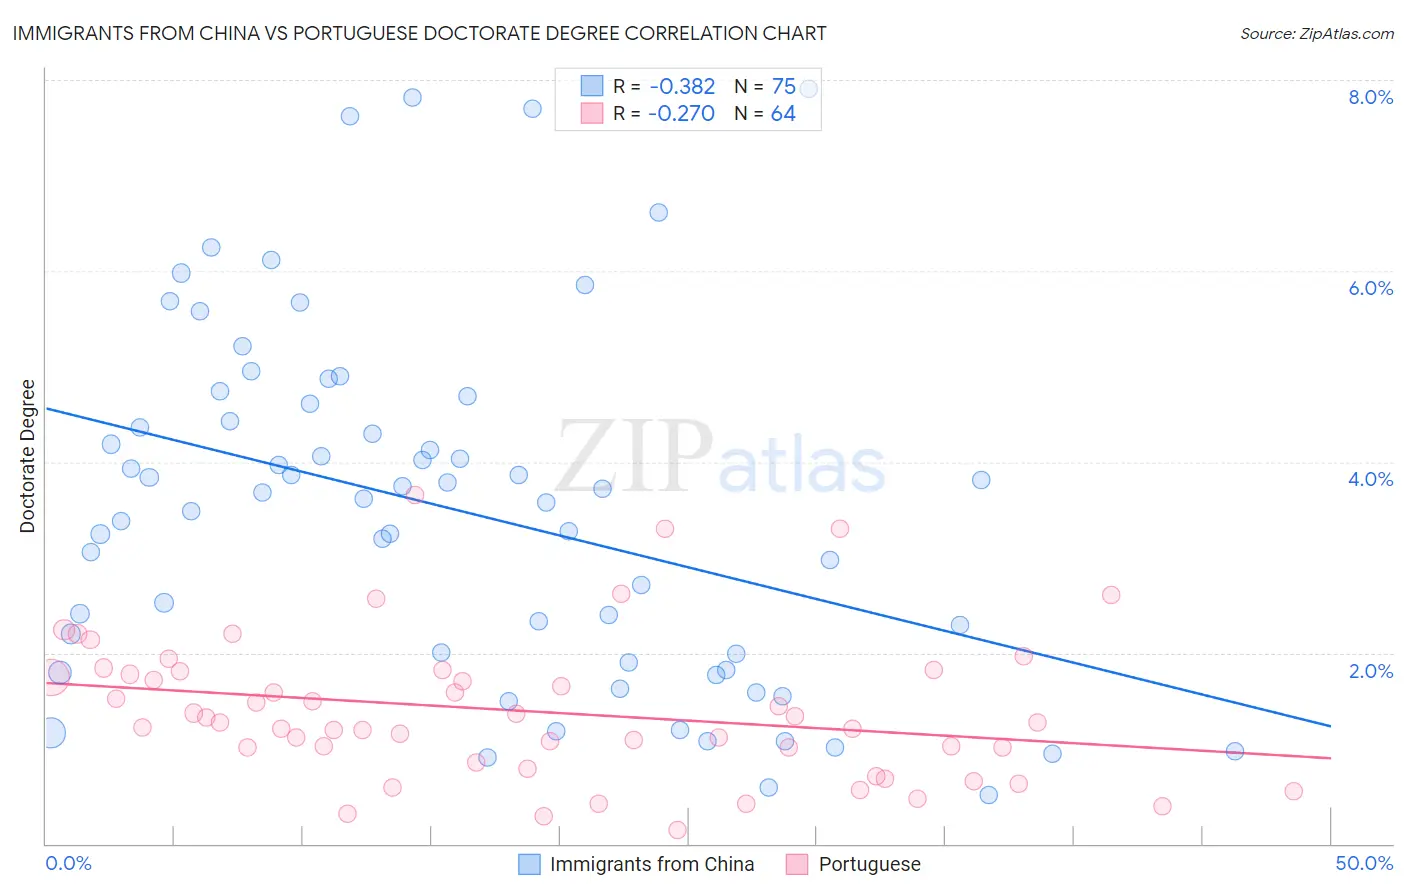
Immigrants from China vs Portuguese Doctorate Degree Correlation Chart
The statistical analysis conducted on geographies consisting of 452,322,361 people shows a mild negative correlation between the proportion of Immigrants from China and percentage of population with at least doctorate degree education in the United States with a correlation coefficient (R) of -0.382 and weighted average of 3.1%. Similarly, the statistical analysis conducted on geographies consisting of 443,772,910 people shows a weak negative correlation between the proportion of Portuguese and percentage of population with at least doctorate degree education in the United States with a correlation coefficient (R) of -0.270 and weighted average of 1.8%, a difference of 76.3%.
Doctorate Degree Correlation Summary
| Measurement | Immigrants from China | Portuguese |
| Minimum | 0.51% | 0.14% |
| Maximum | 7.9% | 3.7% |
| Range | 7.4% | 3.5% |
| Mean | 3.5% | 1.4% |
| Median | 3.6% | 1.3% |
| Interquartile 25% (IQ1) | 1.9% | 0.93% |
| Interquartile 75% (IQ3) | 4.6% | 1.8% |
| Interquartile Range (IQR) | 2.7% | 0.86% |
| Standard Deviation (Sample) | 1.8% | 0.75% |
| Standard Deviation (Population) | 1.8% | 0.74% |
Similar Demographics by Doctorate Degree
Demographics Similar to Immigrants from China by Doctorate Degree
In terms of doctorate degree, the demographic groups most similar to Immigrants from China are Immigrants from Switzerland (3.1%, a difference of 0.070%), Immigrants from Israel (3.0%, a difference of 1.3%), Iranian (3.1%, a difference of 2.0%), Immigrants from Iran (3.0%, a difference of 2.0%), and Immigrants from Taiwan (3.2%, a difference of 3.6%).
| Demographics | Rating | Rank | Doctorate Degree |
| Immigrants | Singapore | 100.0 /100 | #1 | Exceptional 3.7% |
| Filipinos | 100.0 /100 | #2 | Exceptional 3.4% |
| Okinawans | 100.0 /100 | #3 | Exceptional 3.3% |
| Immigrants | Taiwan | 100.0 /100 | #4 | Exceptional 3.2% |
| Iranians | 100.0 /100 | #5 | Exceptional 3.1% |
| Immigrants | Switzerland | 100.0 /100 | #6 | Exceptional 3.1% |
| Immigrants | China | 100.0 /100 | #7 | Exceptional 3.1% |
| Immigrants | Israel | 100.0 /100 | #8 | Exceptional 3.0% |
| Immigrants | Iran | 100.0 /100 | #9 | Exceptional 3.0% |
| Immigrants | Eastern Asia | 100.0 /100 | #10 | Exceptional 3.0% |
| Indians (Asian) | 100.0 /100 | #11 | Exceptional 2.9% |
| Immigrants | Belgium | 100.0 /100 | #12 | Exceptional 2.9% |
| Immigrants | Sweden | 100.0 /100 | #13 | Exceptional 2.9% |
| Immigrants | France | 100.0 /100 | #14 | Exceptional 2.9% |
| Immigrants | India | 100.0 /100 | #15 | Exceptional 2.8% |
Demographics Similar to Portuguese by Doctorate Degree
In terms of doctorate degree, the demographic groups most similar to Portuguese are Immigrants from Vietnam (1.8%, a difference of 0.020%), Somali (1.7%, a difference of 0.050%), Immigrants from Nigeria (1.8%, a difference of 0.23%), White/Caucasian (1.8%, a difference of 0.29%), and Immigrants from South America (1.8%, a difference of 0.40%).
| Demographics | Rating | Rank | Doctorate Degree |
| Immigrants | Somalia | 25.4 /100 | #195 | Fair 1.8% |
| Sub-Saharan Africans | 25.1 /100 | #196 | Fair 1.8% |
| Chinese | 25.1 /100 | #197 | Fair 1.8% |
| Immigrants | Ghana | 24.6 /100 | #198 | Fair 1.8% |
| Immigrants | South America | 23.3 /100 | #199 | Fair 1.8% |
| Whites/Caucasians | 22.8 /100 | #200 | Fair 1.8% |
| Immigrants | Nigeria | 22.4 /100 | #201 | Fair 1.8% |
| Portuguese | 21.4 /100 | #202 | Fair 1.8% |
| Immigrants | Vietnam | 21.4 /100 | #203 | Fair 1.8% |
| Somalis | 21.2 /100 | #204 | Fair 1.7% |
| Venezuelans | 19.5 /100 | #205 | Poor 1.7% |
| Immigrants | Peru | 17.6 /100 | #206 | Poor 1.7% |
| Yugoslavians | 17.1 /100 | #207 | Poor 1.7% |
| Colombians | 16.1 /100 | #208 | Poor 1.7% |
| Immigrants | Western Africa | 15.4 /100 | #209 | Poor 1.7% |