Immigrants from Chile vs Spanish Average Family Size
COMPARE
Immigrants from Chile
Spanish
Average Family Size
Average Family Size Comparison
Immigrants from Chile
Spanish
3.24
AVERAGE FAMILY SIZE
63.2/ 100
METRIC RATING
161st/ 347
METRIC RANK
3.23
AVERAGE FAMILY SIZE
44.8/ 100
METRIC RATING
181st/ 347
METRIC RANK
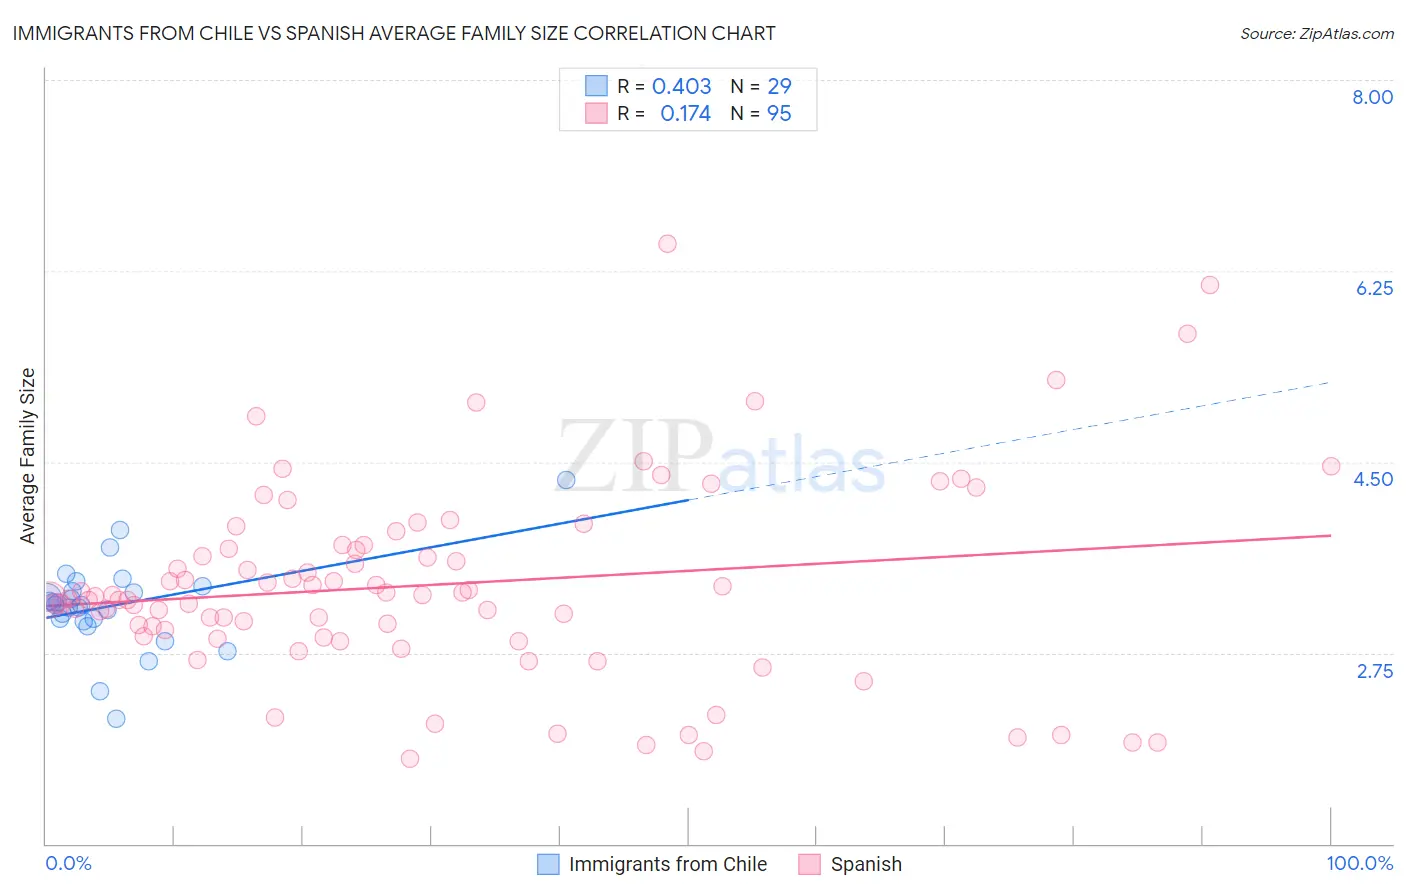
Immigrants from Chile vs Spanish Average Family Size Correlation Chart
The statistical analysis conducted on geographies consisting of 218,601,267 people shows a moderate positive correlation between the proportion of Immigrants from Chile and average family size in the United States with a correlation coefficient (R) of 0.403 and weighted average of 3.24. Similarly, the statistical analysis conducted on geographies consisting of 421,920,076 people shows a poor positive correlation between the proportion of Spanish and average family size in the United States with a correlation coefficient (R) of 0.174 and weighted average of 3.23, a difference of 0.34%.
Average Family Size Correlation Summary
| Measurement | Immigrants from Chile | Spanish |
| Minimum | 2.15 | 1.78 |
| Maximum | 4.33 | 6.50 |
| Range | 2.18 | 4.72 |
| Mean | 3.18 | 3.37 |
| Median | 3.19 | 3.26 |
| Interquartile 25% (IQ1) | 3.05 | 2.90 |
| Interquartile 75% (IQ3) | 3.34 | 3.73 |
| Interquartile Range (IQR) | 0.29 | 0.83 |
| Standard Deviation (Sample) | 0.41 | 0.90 |
| Standard Deviation (Population) | 0.40 | 0.89 |
Demographics Similar to Immigrants from Chile and Spanish by Average Family Size
In terms of average family size, the demographic groups most similar to Immigrants from Chile are Immigrants from Uganda (3.23, a difference of 0.060%), Uruguayan (3.23, a difference of 0.080%), Egyptian (3.23, a difference of 0.090%), Ugandan (3.23, a difference of 0.090%), and Immigrants from Senegal (3.23, a difference of 0.11%). Similarly, the demographic groups most similar to Spanish are Palestinian (3.23, a difference of 0.030%), Spaniard (3.23, a difference of 0.040%), Immigrants from Korea (3.23, a difference of 0.040%), Argentinean (3.23, a difference of 0.050%), and Israeli (3.23, a difference of 0.070%).
| Demographics | Rating | Rank | Average Family Size |
| Immigrants | Chile | 63.2 /100 | #161 | Good 3.24 |
| Immigrants | Uganda | 60.1 /100 | #162 | Good 3.23 |
| Uruguayans | 58.8 /100 | #163 | Average 3.23 |
| Egyptians | 58.6 /100 | #164 | Average 3.23 |
| Ugandans | 58.4 /100 | #165 | Average 3.23 |
| Immigrants | Senegal | 57.5 /100 | #166 | Average 3.23 |
| Dutch West Indians | 56.9 /100 | #167 | Average 3.23 |
| Taiwanese | 54.2 /100 | #168 | Average 3.23 |
| Aleuts | 54.1 /100 | #169 | Average 3.23 |
| Arabs | 53.8 /100 | #170 | Average 3.23 |
| Chileans | 53.2 /100 | #171 | Average 3.23 |
| Immigrants | Congo | 52.7 /100 | #172 | Average 3.23 |
| Immigrants | Uruguay | 52.0 /100 | #173 | Average 3.23 |
| Immigrants | South Central Asia | 50.0 /100 | #174 | Average 3.23 |
| Immigrants | China | 49.9 /100 | #175 | Average 3.23 |
| Israelis | 48.7 /100 | #176 | Average 3.23 |
| Argentineans | 47.4 /100 | #177 | Average 3.23 |
| Spaniards | 47.2 /100 | #178 | Average 3.23 |
| Immigrants | Korea | 46.9 /100 | #179 | Average 3.23 |
| Palestinians | 46.6 /100 | #180 | Average 3.23 |
| Spanish | 44.8 /100 | #181 | Average 3.23 |