Immigrants from Chile vs Cypriot Average Family Size
COMPARE
Immigrants from Chile
Cypriot
Average Family Size
Average Family Size Comparison
Immigrants from Chile
Cypriots
3.24
AVERAGE FAMILY SIZE
63.2/ 100
METRIC RATING
161st/ 347
METRIC RANK
3.14
AVERAGE FAMILY SIZE
0.3/ 100
METRIC RATING
290th/ 347
METRIC RANK
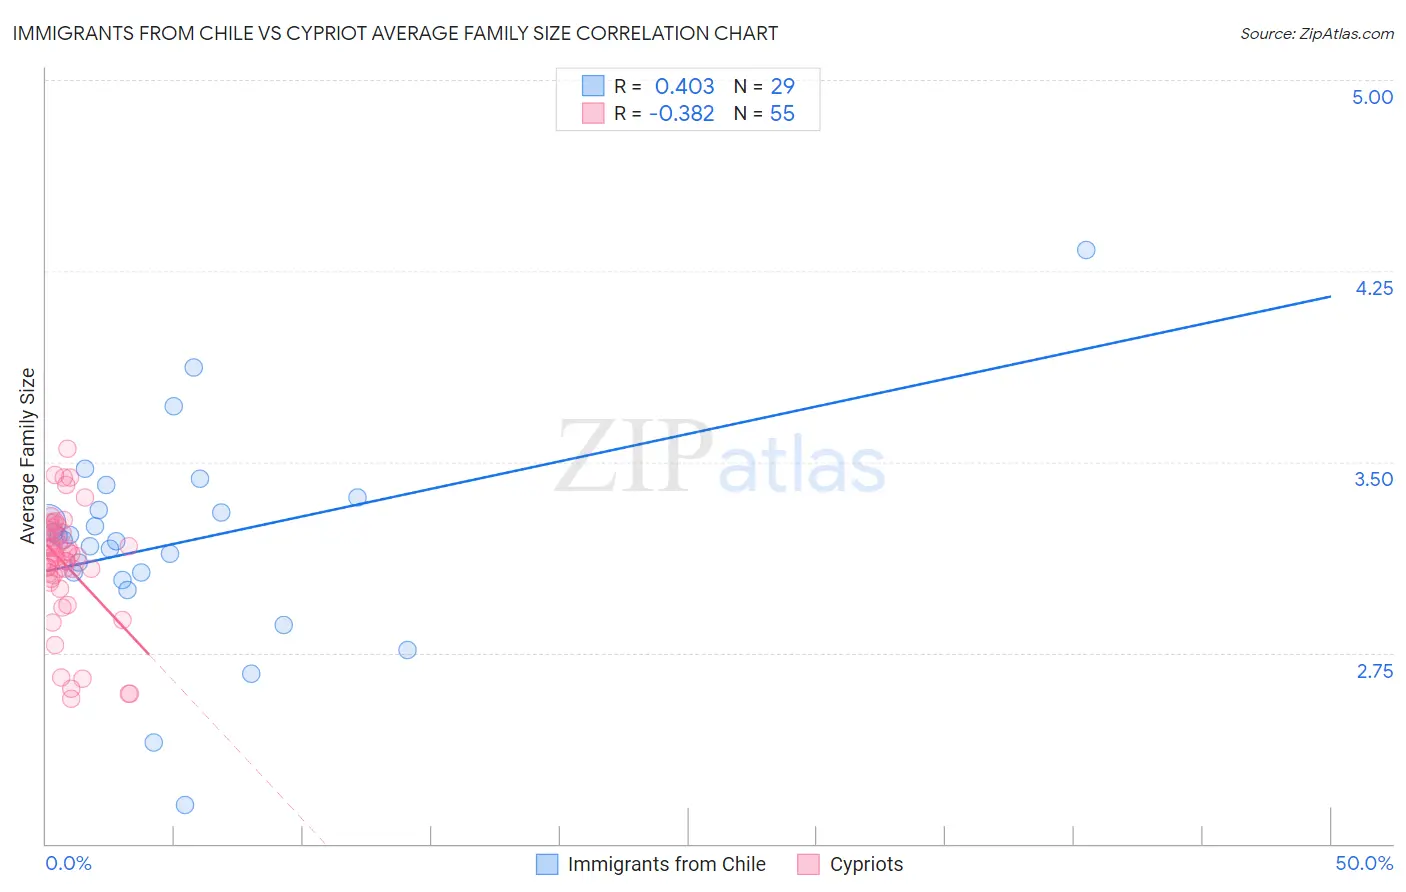
Immigrants from Chile vs Cypriot Average Family Size Correlation Chart
The statistical analysis conducted on geographies consisting of 218,601,267 people shows a moderate positive correlation between the proportion of Immigrants from Chile and average family size in the United States with a correlation coefficient (R) of 0.403 and weighted average of 3.24. Similarly, the statistical analysis conducted on geographies consisting of 61,854,678 people shows a mild negative correlation between the proportion of Cypriots and average family size in the United States with a correlation coefficient (R) of -0.382 and weighted average of 3.14, a difference of 3.0%.
Average Family Size Correlation Summary
| Measurement | Immigrants from Chile | Cypriot |
| Minimum | 2.15 | 2.57 |
| Maximum | 4.33 | 3.55 |
| Range | 2.18 | 0.98 |
| Mean | 3.18 | 3.10 |
| Median | 3.19 | 3.13 |
| Interquartile 25% (IQ1) | 3.05 | 3.04 |
| Interquartile 75% (IQ3) | 3.34 | 3.23 |
| Interquartile Range (IQR) | 0.29 | 0.19 |
| Standard Deviation (Sample) | 0.41 | 0.22 |
| Standard Deviation (Population) | 0.40 | 0.22 |
Similar Demographics by Average Family Size
Demographics Similar to Immigrants from Chile by Average Family Size
In terms of average family size, the demographic groups most similar to Immigrants from Chile are Ethiopian (3.24, a difference of 0.010%), Immigrants from Iraq (3.24, a difference of 0.010%), Iraqi (3.24, a difference of 0.020%), Immigrants from Uganda (3.23, a difference of 0.060%), and Immigrants from Uzbekistan (3.24, a difference of 0.080%).
| Demographics | Rating | Rank | Average Family Size |
| Immigrants | Egypt | 70.0 /100 | #154 | Good 3.24 |
| Seminole | 68.2 /100 | #155 | Good 3.24 |
| Immigrants | Taiwan | 68.1 /100 | #156 | Good 3.24 |
| Immigrants | Uzbekistan | 67.0 /100 | #157 | Good 3.24 |
| Iraqis | 64.3 /100 | #158 | Good 3.24 |
| Ethiopians | 63.9 /100 | #159 | Good 3.24 |
| Immigrants | Iraq | 63.7 /100 | #160 | Good 3.24 |
| Immigrants | Chile | 63.2 /100 | #161 | Good 3.24 |
| Immigrants | Uganda | 60.1 /100 | #162 | Good 3.23 |
| Uruguayans | 58.8 /100 | #163 | Average 3.23 |
| Egyptians | 58.6 /100 | #164 | Average 3.23 |
| Ugandans | 58.4 /100 | #165 | Average 3.23 |
| Immigrants | Senegal | 57.5 /100 | #166 | Average 3.23 |
| Dutch West Indians | 56.9 /100 | #167 | Average 3.23 |
| Taiwanese | 54.2 /100 | #168 | Average 3.23 |
Demographics Similar to Cypriots by Average Family Size
In terms of average family size, the demographic groups most similar to Cypriots are Greek (3.14, a difference of 0.030%), Immigrants from Czechoslovakia (3.14, a difference of 0.030%), Immigrants from Norway (3.14, a difference of 0.030%), Immigrants from Netherlands (3.14, a difference of 0.040%), and Alsatian (3.14, a difference of 0.040%).
| Demographics | Rating | Rank | Average Family Size |
| German Russians | 0.4 /100 | #283 | Tragic 3.15 |
| Immigrants | France | 0.4 /100 | #284 | Tragic 3.15 |
| Whites/Caucasians | 0.3 /100 | #285 | Tragic 3.14 |
| Immigrants | Netherlands | 0.3 /100 | #286 | Tragic 3.14 |
| Greeks | 0.3 /100 | #287 | Tragic 3.14 |
| Immigrants | Czechoslovakia | 0.3 /100 | #288 | Tragic 3.14 |
| Immigrants | Norway | 0.3 /100 | #289 | Tragic 3.14 |
| Cypriots | 0.3 /100 | #290 | Tragic 3.14 |
| Alsatians | 0.2 /100 | #291 | Tragic 3.14 |
| Europeans | 0.2 /100 | #292 | Tragic 3.14 |
| Scandinavians | 0.2 /100 | #293 | Tragic 3.14 |
| Immigrants | Croatia | 0.2 /100 | #294 | Tragic 3.14 |
| Austrians | 0.2 /100 | #295 | Tragic 3.14 |
| Ukrainians | 0.2 /100 | #296 | Tragic 3.14 |
| Immigrants | Western Europe | 0.2 /100 | #297 | Tragic 3.14 |