Immigrants from Central America vs Immigrants from Western Asia Unemployment Among Ages 20 to 24 years
COMPARE
Immigrants from Central America
Immigrants from Western Asia
Unemployment Among Ages 20 to 24 years
Unemployment Among Ages 20 to 24 years Comparison
Immigrants from Central America
Immigrants from Western Asia
10.7%
UNEMPLOYMENT AMONG AGES 20 TO 24 YEARS
2.0/ 100
METRIC RATING
240th/ 347
METRIC RANK
10.9%
UNEMPLOYMENT AMONG AGES 20 TO 24 YEARS
0.3/ 100
METRIC RATING
257th/ 347
METRIC RANK
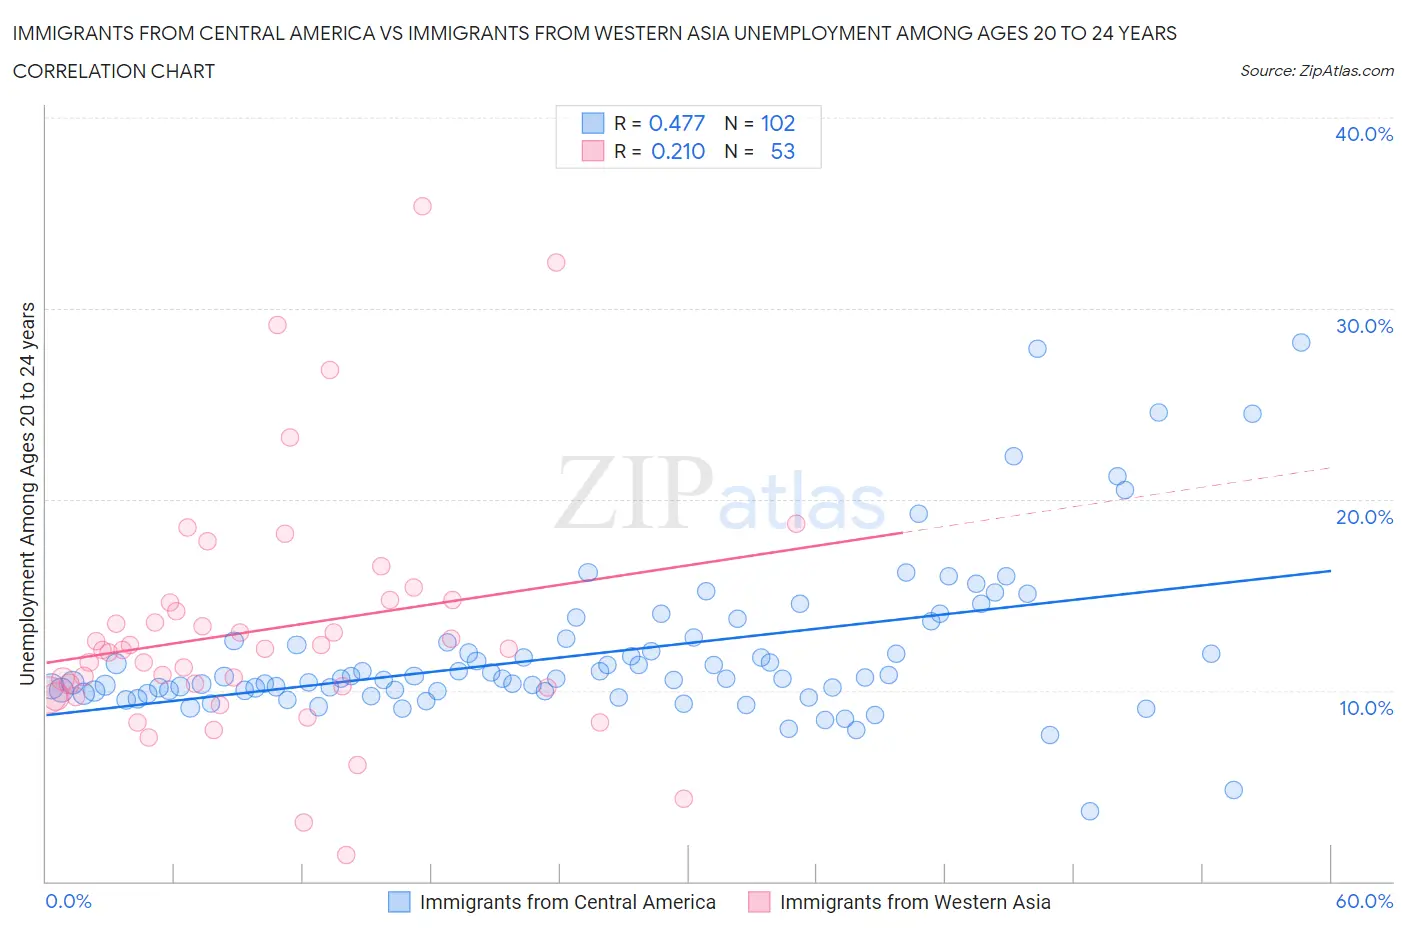
Immigrants from Central America vs Immigrants from Western Asia Unemployment Among Ages 20 to 24 years Correlation Chart
The statistical analysis conducted on geographies consisting of 502,329,663 people shows a moderate positive correlation between the proportion of Immigrants from Central America and unemployment rate among population between the ages 20 and 24 in the United States with a correlation coefficient (R) of 0.477 and weighted average of 10.7%. Similarly, the statistical analysis conducted on geographies consisting of 393,132,982 people shows a weak positive correlation between the proportion of Immigrants from Western Asia and unemployment rate among population between the ages 20 and 24 in the United States with a correlation coefficient (R) of 0.210 and weighted average of 10.9%, a difference of 1.8%.
Unemployment Among Ages 20 to 24 years Correlation Summary
| Measurement | Immigrants from Central America | Immigrants from Western Asia |
| Minimum | 3.7% | 1.4% |
| Maximum | 28.2% | 35.4% |
| Range | 24.5% | 34.0% |
| Mean | 12.0% | 13.2% |
| Median | 10.6% | 12.1% |
| Interquartile 25% (IQ1) | 10.0% | 10.0% |
| Interquartile 75% (IQ3) | 12.6% | 14.6% |
| Interquartile Range (IQR) | 2.6% | 4.7% |
| Standard Deviation (Sample) | 4.1% | 6.4% |
| Standard Deviation (Population) | 4.1% | 6.4% |
Demographics Similar to Immigrants from Central America and Immigrants from Western Asia by Unemployment Among Ages 20 to 24 years
In terms of unemployment among ages 20 to 24 years, the demographic groups most similar to Immigrants from Central America are Immigrants from El Salvador (10.7%, a difference of 0.14%), Salvadoran (10.7%, a difference of 0.19%), Immigrants from Pakistan (10.6%, a difference of 0.25%), Moroccan (10.7%, a difference of 0.31%), and Immigrants from Belarus (10.7%, a difference of 0.35%). Similarly, the demographic groups most similar to Immigrants from Western Asia are Immigrants from Bahamas (10.9%, a difference of 0.070%), Dutch West Indian (10.9%, a difference of 0.070%), Liberian (10.8%, a difference of 0.17%), Immigrants from Israel (10.8%, a difference of 0.17%), and Spanish American (10.8%, a difference of 0.29%).
| Demographics | Rating | Rank | Unemployment Among Ages 20 to 24 years |
| Immigrants | Pakistan | 2.6 /100 | #238 | Tragic 10.6% |
| Salvadorans | 2.4 /100 | #239 | Tragic 10.7% |
| Immigrants | Central America | 2.0 /100 | #240 | Tragic 10.7% |
| Immigrants | El Salvador | 1.7 /100 | #241 | Tragic 10.7% |
| Moroccans | 1.4 /100 | #242 | Tragic 10.7% |
| Immigrants | Belarus | 1.3 /100 | #243 | Tragic 10.7% |
| Immigrants | Mexico | 1.2 /100 | #244 | Tragic 10.7% |
| Hispanics or Latinos | 1.0 /100 | #245 | Tragic 10.7% |
| Immigrants | Iran | 0.9 /100 | #246 | Tragic 10.8% |
| Immigrants | Albania | 0.7 /100 | #247 | Tragic 10.8% |
| Cree | 0.6 /100 | #248 | Tragic 10.8% |
| South American Indians | 0.5 /100 | #249 | Tragic 10.8% |
| Albanians | 0.5 /100 | #250 | Tragic 10.8% |
| Immigrants | Panama | 0.4 /100 | #251 | Tragic 10.8% |
| Immigrants | Syria | 0.4 /100 | #252 | Tragic 10.8% |
| Spanish Americans | 0.4 /100 | #253 | Tragic 10.8% |
| Liberians | 0.3 /100 | #254 | Tragic 10.8% |
| Immigrants | Israel | 0.3 /100 | #255 | Tragic 10.8% |
| Immigrants | Bahamas | 0.3 /100 | #256 | Tragic 10.9% |
| Immigrants | Western Asia | 0.3 /100 | #257 | Tragic 10.9% |
| Dutch West Indians | 0.3 /100 | #258 | Tragic 10.9% |