Sioux vs Bangladeshi Family Households
COMPARE
Sioux
Bangladeshi
Family Households
Family Households Comparison
Sioux
Bangladeshis
64.6%
FAMILY HOUSEHOLDS
76.3/ 100
METRIC RATING
149th/ 347
METRIC RANK
64.3%
FAMILY HOUSEHOLDS
44.3/ 100
METRIC RATING
175th/ 347
METRIC RANK
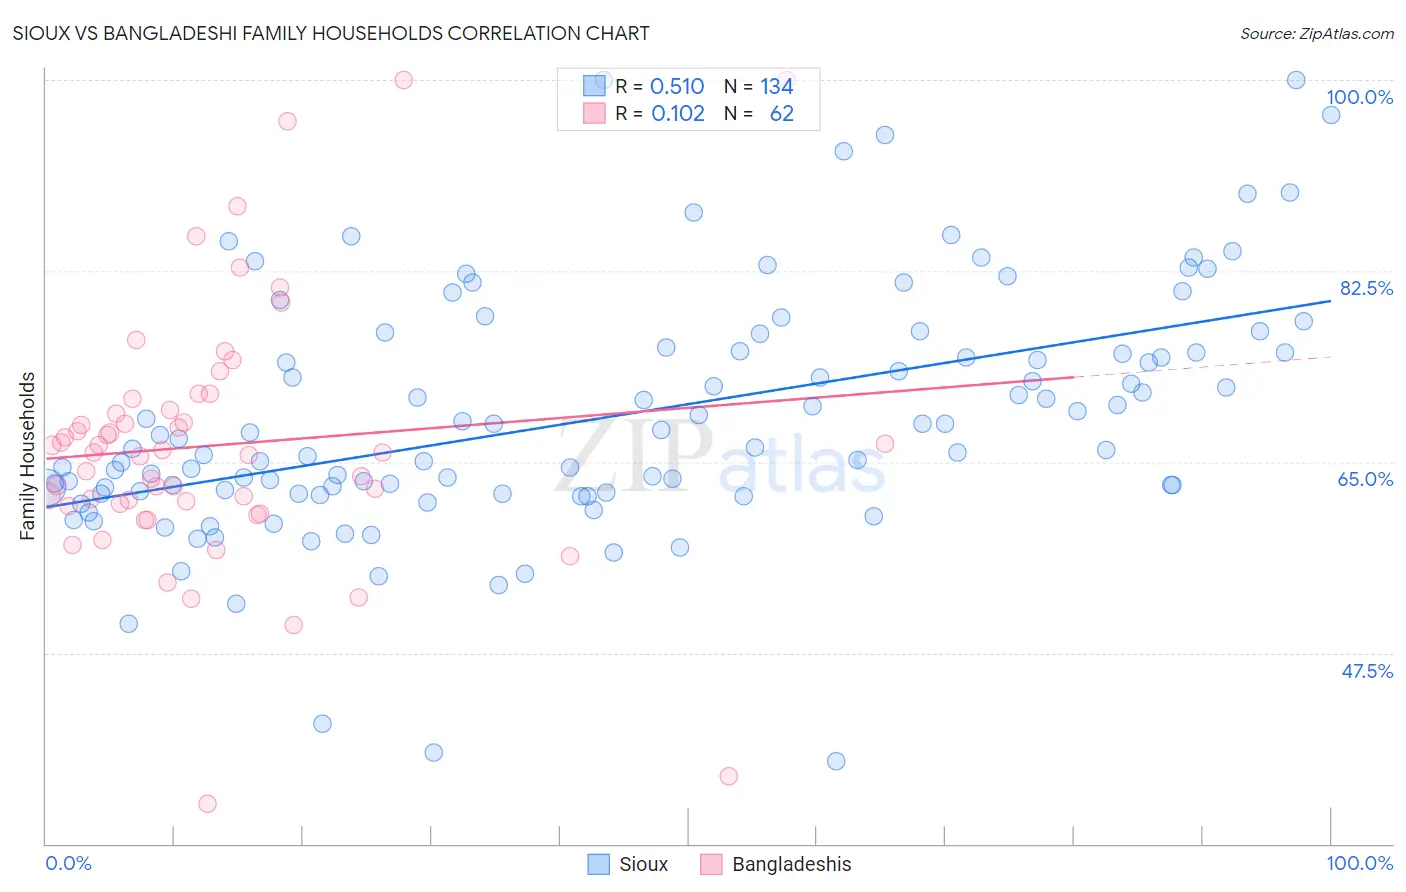
Sioux vs Bangladeshi Family Households Correlation Chart
The statistical analysis conducted on geographies consisting of 234,114,463 people shows a substantial positive correlation between the proportion of Sioux and percentage of family households in the United States with a correlation coefficient (R) of 0.510 and weighted average of 64.6%. Similarly, the statistical analysis conducted on geographies consisting of 141,333,062 people shows a poor positive correlation between the proportion of Bangladeshis and percentage of family households in the United States with a correlation coefficient (R) of 0.102 and weighted average of 64.3%, a difference of 0.47%.
Family Households Correlation Summary
| Measurement | Sioux | Bangladeshi |
| Minimum | 37.6% | 33.7% |
| Maximum | 100.0% | 100.0% |
| Range | 62.4% | 66.3% |
| Mean | 69.1% | 66.5% |
| Median | 66.7% | 65.9% |
| Interquartile 25% (IQ1) | 62.2% | 61.1% |
| Interquartile 75% (IQ3) | 75.2% | 69.8% |
| Interquartile Range (IQR) | 13.0% | 8.7% |
| Standard Deviation (Sample) | 11.2% | 11.9% |
| Standard Deviation (Population) | 11.1% | 11.8% |
Similar Demographics by Family Households
Demographics Similar to Sioux by Family Households
In terms of family households, the demographic groups most similar to Sioux are Immigrants from Chile (64.6%, a difference of 0.0%), Delaware (64.6%, a difference of 0.0%), Immigrants from Romania (64.6%, a difference of 0.010%), Romanian (64.5%, a difference of 0.020%), and Syrian (64.5%, a difference of 0.020%).
| Demographics | Rating | Rank | Family Households |
| Pakistanis | 84.0 /100 | #142 | Excellent 64.7% |
| Czechoslovakians | 82.1 /100 | #143 | Excellent 64.6% |
| South American Indians | 81.9 /100 | #144 | Excellent 64.6% |
| Welsh | 80.1 /100 | #145 | Excellent 64.6% |
| Immigrants | Romania | 77.0 /100 | #146 | Good 64.6% |
| Immigrants | Chile | 76.5 /100 | #147 | Good 64.6% |
| Delaware | 76.3 /100 | #148 | Good 64.6% |
| Sioux | 76.3 /100 | #149 | Good 64.6% |
| Romanians | 75.3 /100 | #150 | Good 64.5% |
| Syrians | 75.2 /100 | #151 | Good 64.5% |
| Scottish | 70.9 /100 | #152 | Good 64.5% |
| Swedes | 69.8 /100 | #153 | Good 64.5% |
| Austrians | 68.5 /100 | #154 | Good 64.5% |
| Uruguayans | 67.7 /100 | #155 | Good 64.5% |
| Czechs | 67.0 /100 | #156 | Good 64.5% |
Demographics Similar to Bangladeshis by Family Households
In terms of family households, the demographic groups most similar to Bangladeshis are Vietnamese (64.2%, a difference of 0.010%), Immigrants from Micronesia (64.2%, a difference of 0.030%), Jamaican (64.2%, a difference of 0.050%), Immigrants from Germany (64.3%, a difference of 0.080%), and Immigrants from Ukraine (64.2%, a difference of 0.080%).
| Demographics | Rating | Rank | Family Households |
| Hondurans | 57.5 /100 | #168 | Average 64.4% |
| Iraqis | 56.0 /100 | #169 | Average 64.4% |
| Armenians | 55.9 /100 | #170 | Average 64.4% |
| Ute | 54.6 /100 | #171 | Average 64.3% |
| Dutch West Indians | 53.9 /100 | #172 | Average 64.3% |
| Immigrants | Sierra Leone | 52.5 /100 | #173 | Average 64.3% |
| Immigrants | Germany | 50.0 /100 | #174 | Average 64.3% |
| Bangladeshis | 44.3 /100 | #175 | Average 64.3% |
| Vietnamese | 43.6 /100 | #176 | Average 64.2% |
| Immigrants | Micronesia | 42.3 /100 | #177 | Average 64.2% |
| Jamaicans | 40.6 /100 | #178 | Average 64.2% |
| Immigrants | Ukraine | 38.2 /100 | #179 | Fair 64.2% |
| Immigrants | Honduras | 35.0 /100 | #180 | Fair 64.2% |
| Immigrants | Trinidad and Tobago | 34.9 /100 | #181 | Fair 64.2% |
| Ukrainians | 34.6 /100 | #182 | Fair 64.2% |