Immigrants from Canada vs Immigrants from Vietnam Family Households with Children
COMPARE
Immigrants from Canada
Immigrants from Vietnam
Family Households with Children
Family Households with Children Comparison
Immigrants from Canada
Immigrants from Vietnam
26.5%
FAMILY HOUSEHOLDS WITH CHILDREN
0.3/ 100
METRIC RATING
284th/ 347
METRIC RANK
29.5%
FAMILY HOUSEHOLDS WITH CHILDREN
100.0/ 100
METRIC RATING
27th/ 347
METRIC RANK
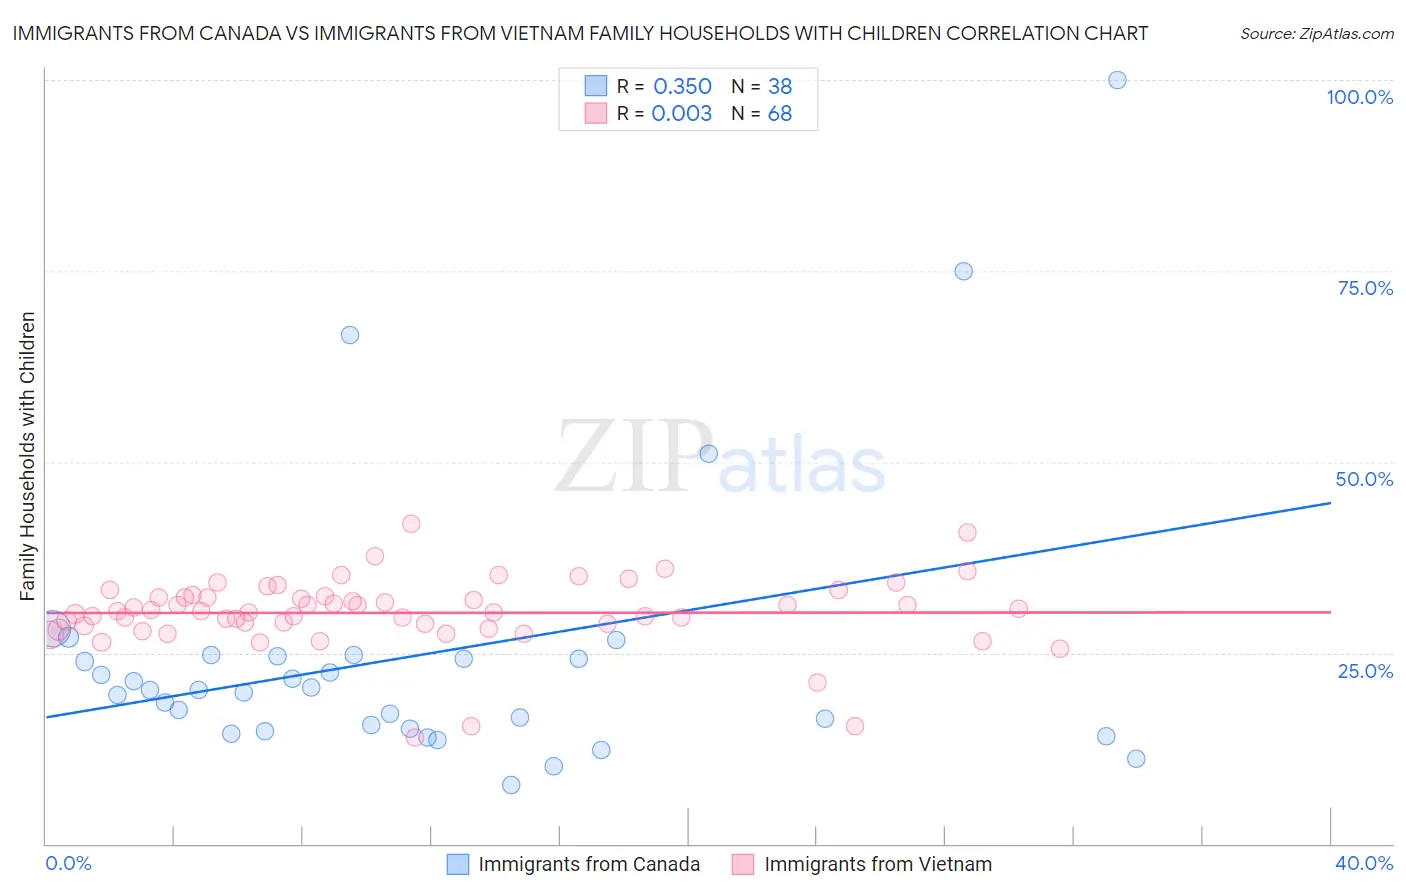
Immigrants from Canada vs Immigrants from Vietnam Family Households with Children Correlation Chart
The statistical analysis conducted on geographies consisting of 458,900,901 people shows a mild positive correlation between the proportion of Immigrants from Canada and percentage of family households with children in the United States with a correlation coefficient (R) of 0.350 and weighted average of 26.5%. Similarly, the statistical analysis conducted on geographies consisting of 404,427,903 people shows no correlation between the proportion of Immigrants from Vietnam and percentage of family households with children in the United States with a correlation coefficient (R) of 0.003 and weighted average of 29.5%, a difference of 11.3%.
Family Households with Children Correlation Summary
| Measurement | Immigrants from Canada | Immigrants from Vietnam |
| Minimum | 7.6% | 13.9% |
| Maximum | 100.0% | 41.9% |
| Range | 92.4% | 28.0% |
| Mean | 24.6% | 30.2% |
| Median | 20.1% | 30.4% |
| Interquartile 25% (IQ1) | 15.0% | 28.7% |
| Interquartile 75% (IQ3) | 24.6% | 32.4% |
| Interquartile Range (IQR) | 9.6% | 3.7% |
| Standard Deviation (Sample) | 18.5% | 4.7% |
| Standard Deviation (Population) | 18.3% | 4.7% |
Similar Demographics by Family Households with Children
Demographics Similar to Immigrants from Canada by Family Households with Children
In terms of family households with children, the demographic groups most similar to Immigrants from Canada are Immigrants from North America (26.6%, a difference of 0.020%), Cambodian (26.5%, a difference of 0.030%), Immigrants from Senegal (26.5%, a difference of 0.080%), French American Indian (26.6%, a difference of 0.090%), and Shoshone (26.5%, a difference of 0.090%).
| Demographics | Rating | Rank | Family Households with Children |
| Celtics | 0.4 /100 | #277 | Tragic 26.6% |
| Immigrants | Europe | 0.4 /100 | #278 | Tragic 26.6% |
| Finns | 0.4 /100 | #279 | Tragic 26.6% |
| Senegalese | 0.4 /100 | #280 | Tragic 26.6% |
| Lithuanians | 0.3 /100 | #281 | Tragic 26.6% |
| French American Indians | 0.3 /100 | #282 | Tragic 26.6% |
| Immigrants | North America | 0.3 /100 | #283 | Tragic 26.6% |
| Immigrants | Canada | 0.3 /100 | #284 | Tragic 26.5% |
| Cambodians | 0.2 /100 | #285 | Tragic 26.5% |
| Immigrants | Senegal | 0.2 /100 | #286 | Tragic 26.5% |
| Shoshone | 0.2 /100 | #287 | Tragic 26.5% |
| Russians | 0.2 /100 | #288 | Tragic 26.5% |
| Immigrants | Sweden | 0.2 /100 | #289 | Tragic 26.5% |
| Albanians | 0.2 /100 | #290 | Tragic 26.5% |
| Bahamians | 0.2 /100 | #291 | Tragic 26.5% |
Demographics Similar to Immigrants from Vietnam by Family Households with Children
In terms of family households with children, the demographic groups most similar to Immigrants from Vietnam are Sri Lankan (29.5%, a difference of 0.030%), Samoan (29.5%, a difference of 0.16%), Bolivian (29.5%, a difference of 0.16%), Yuman (29.5%, a difference of 0.19%), and Japanese (29.4%, a difference of 0.34%).
| Demographics | Rating | Rank | Family Households with Children |
| Immigrants | El Salvador | 100.0 /100 | #20 | Exceptional 29.8% |
| Immigrants | Laos | 100.0 /100 | #21 | Exceptional 29.8% |
| Malaysians | 100.0 /100 | #22 | Exceptional 29.8% |
| Mexican American Indians | 100.0 /100 | #23 | Exceptional 29.7% |
| Guamanians/Chamorros | 100.0 /100 | #24 | Exceptional 29.7% |
| Immigrants | Latin America | 100.0 /100 | #25 | Exceptional 29.7% |
| Sri Lankans | 100.0 /100 | #26 | Exceptional 29.5% |
| Immigrants | Vietnam | 100.0 /100 | #27 | Exceptional 29.5% |
| Samoans | 100.0 /100 | #28 | Exceptional 29.5% |
| Bolivians | 100.0 /100 | #29 | Exceptional 29.5% |
| Yuman | 100.0 /100 | #30 | Exceptional 29.5% |
| Japanese | 100.0 /100 | #31 | Exceptional 29.4% |
| Immigrants | Yemen | 100.0 /100 | #32 | Exceptional 29.4% |
| Venezuelans | 100.0 /100 | #33 | Exceptional 29.4% |
| Immigrants | Bolivia | 100.0 /100 | #34 | Exceptional 29.3% |