Immigrants from Cameroon vs Dutch Single Mother Households
COMPARE
Immigrants from Cameroon
Dutch
Single Mother Households
Single Mother Households Comparison
Immigrants from Cameroon
Dutch
7.9%
SINGLE MOTHER HOUSEHOLDS
0.0/ 100
METRIC RATING
293rd/ 347
METRIC RANK
5.8%
SINGLE MOTHER HOUSEHOLDS
95.1/ 100
METRIC RATING
114th/ 347
METRIC RANK
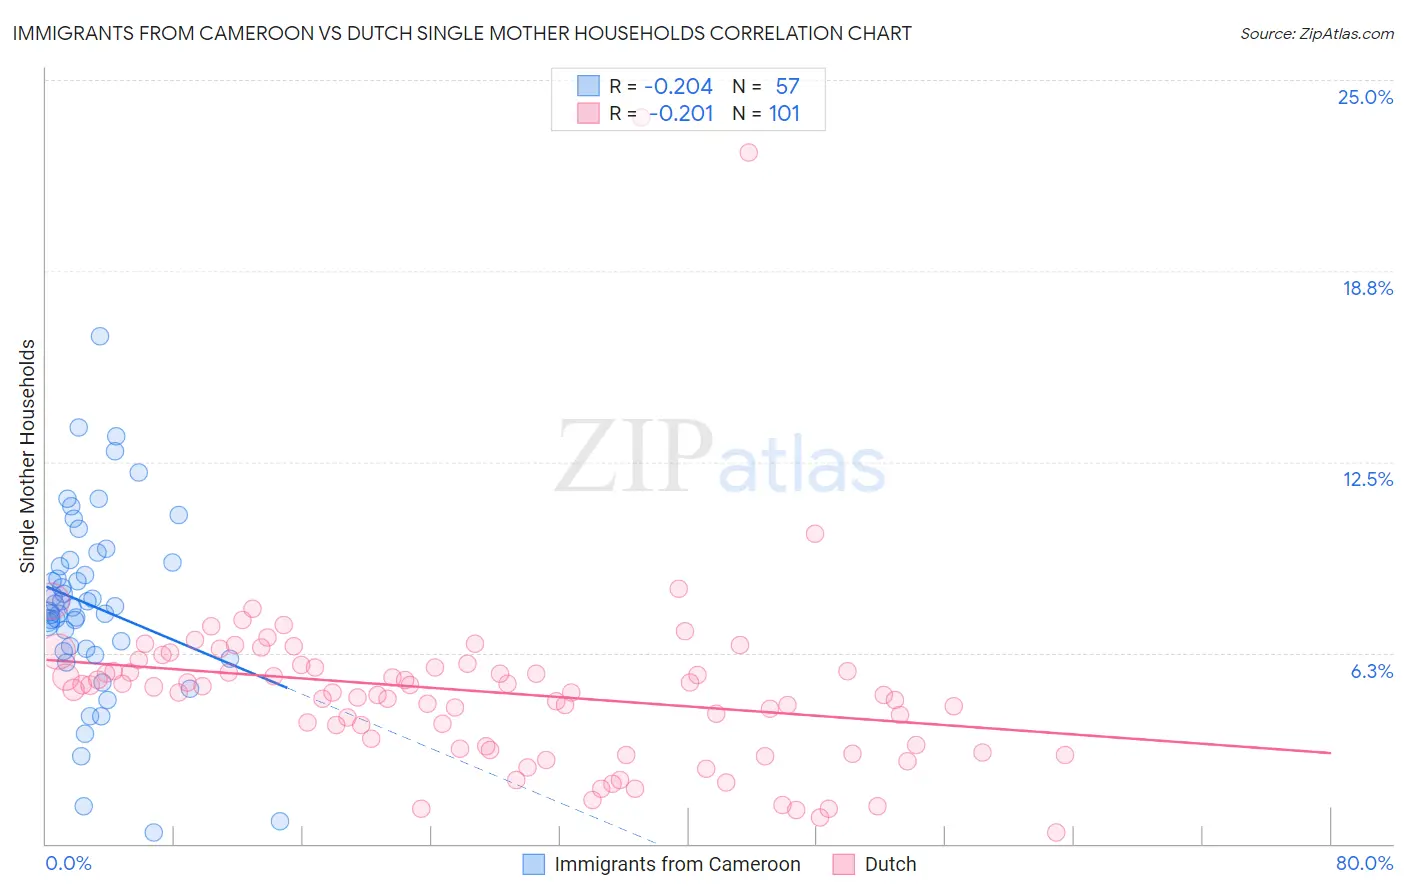
Immigrants from Cameroon vs Dutch Single Mother Households Correlation Chart
The statistical analysis conducted on geographies consisting of 130,708,507 people shows a weak negative correlation between the proportion of Immigrants from Cameroon and percentage of single mother households in the United States with a correlation coefficient (R) of -0.204 and weighted average of 7.9%. Similarly, the statistical analysis conducted on geographies consisting of 549,817,585 people shows a weak negative correlation between the proportion of Dutch and percentage of single mother households in the United States with a correlation coefficient (R) of -0.201 and weighted average of 5.8%, a difference of 35.8%.
Single Mother Households Correlation Summary
| Measurement | Immigrants from Cameroon | Dutch |
| Minimum | 0.36% | 0.36% |
| Maximum | 16.6% | 23.8% |
| Range | 16.2% | 23.4% |
| Mean | 7.8% | 5.0% |
| Median | 7.7% | 5.0% |
| Interquartile 25% (IQ1) | 6.3% | 3.1% |
| Interquartile 75% (IQ3) | 9.3% | 5.8% |
| Interquartile Range (IQR) | 2.9% | 2.7% |
| Standard Deviation (Sample) | 3.0% | 3.2% |
| Standard Deviation (Population) | 3.0% | 3.2% |
Similar Demographics by Single Mother Households
Demographics Similar to Immigrants from Cameroon by Single Mother Households
In terms of single mother households, the demographic groups most similar to Immigrants from Cameroon are Apache (7.9%, a difference of 0.10%), Ghanaian (7.8%, a difference of 0.36%), West Indian (7.8%, a difference of 0.37%), Barbadian (7.9%, a difference of 0.39%), and Immigrants from Nigeria (7.8%, a difference of 0.45%).
| Demographics | Rating | Rank | Single Mother Households |
| Immigrants | Middle Africa | 0.0 /100 | #286 | Tragic 7.7% |
| Immigrants | Guatemala | 0.0 /100 | #287 | Tragic 7.7% |
| Sierra Leoneans | 0.0 /100 | #288 | Tragic 7.7% |
| Sub-Saharan Africans | 0.0 /100 | #289 | Tragic 7.8% |
| Immigrants | Nigeria | 0.0 /100 | #290 | Tragic 7.8% |
| West Indians | 0.0 /100 | #291 | Tragic 7.8% |
| Ghanaians | 0.0 /100 | #292 | Tragic 7.8% |
| Immigrants | Cameroon | 0.0 /100 | #293 | Tragic 7.9% |
| Apache | 0.0 /100 | #294 | Tragic 7.9% |
| Barbadians | 0.0 /100 | #295 | Tragic 7.9% |
| Immigrants | Latin America | 0.0 /100 | #296 | Tragic 7.9% |
| Hispanics or Latinos | 0.0 /100 | #297 | Tragic 7.9% |
| Immigrants | West Indies | 0.0 /100 | #298 | Tragic 7.9% |
| Houma | 0.0 /100 | #299 | Tragic 7.9% |
| Mexicans | 0.0 /100 | #300 | Tragic 8.0% |
Demographics Similar to Dutch by Single Mother Households
In terms of single mother households, the demographic groups most similar to Dutch are Mongolian (5.8%, a difference of 0.13%), Irish (5.8%, a difference of 0.19%), Immigrants from Kuwait (5.8%, a difference of 0.20%), Immigrants from England (5.8%, a difference of 0.24%), and Pennsylvania German (5.8%, a difference of 0.25%).
| Demographics | Rating | Rank | Single Mother Households |
| Paraguayans | 95.8 /100 | #107 | Exceptional 5.8% |
| Immigrants | Italy | 95.8 /100 | #108 | Exceptional 5.8% |
| Immigrants | Western Europe | 95.7 /100 | #109 | Exceptional 5.8% |
| British | 95.5 /100 | #110 | Exceptional 5.8% |
| Immigrants | England | 95.5 /100 | #111 | Exceptional 5.8% |
| Immigrants | Kuwait | 95.4 /100 | #112 | Exceptional 5.8% |
| Mongolians | 95.3 /100 | #113 | Exceptional 5.8% |
| Dutch | 95.1 /100 | #114 | Exceptional 5.8% |
| Irish | 94.8 /100 | #115 | Exceptional 5.8% |
| Pennsylvania Germans | 94.7 /100 | #116 | Exceptional 5.8% |
| Bolivians | 94.6 /100 | #117 | Exceptional 5.8% |
| Laotians | 94.3 /100 | #118 | Exceptional 5.8% |
| South Africans | 94.1 /100 | #119 | Exceptional 5.8% |
| Tongans | 93.7 /100 | #120 | Exceptional 5.8% |
| Argentineans | 93.7 /100 | #121 | Exceptional 5.8% |