Immigrants from Cameroon vs Czechoslovakian Single Mother Households
COMPARE
Immigrants from Cameroon
Czechoslovakian
Single Mother Households
Single Mother Households Comparison
Immigrants from Cameroon
Czechoslovakians
7.9%
SINGLE MOTHER HOUSEHOLDS
0.0/ 100
METRIC RATING
293rd/ 347
METRIC RANK
5.9%
SINGLE MOTHER HOUSEHOLDS
92.2/ 100
METRIC RATING
128th/ 347
METRIC RANK
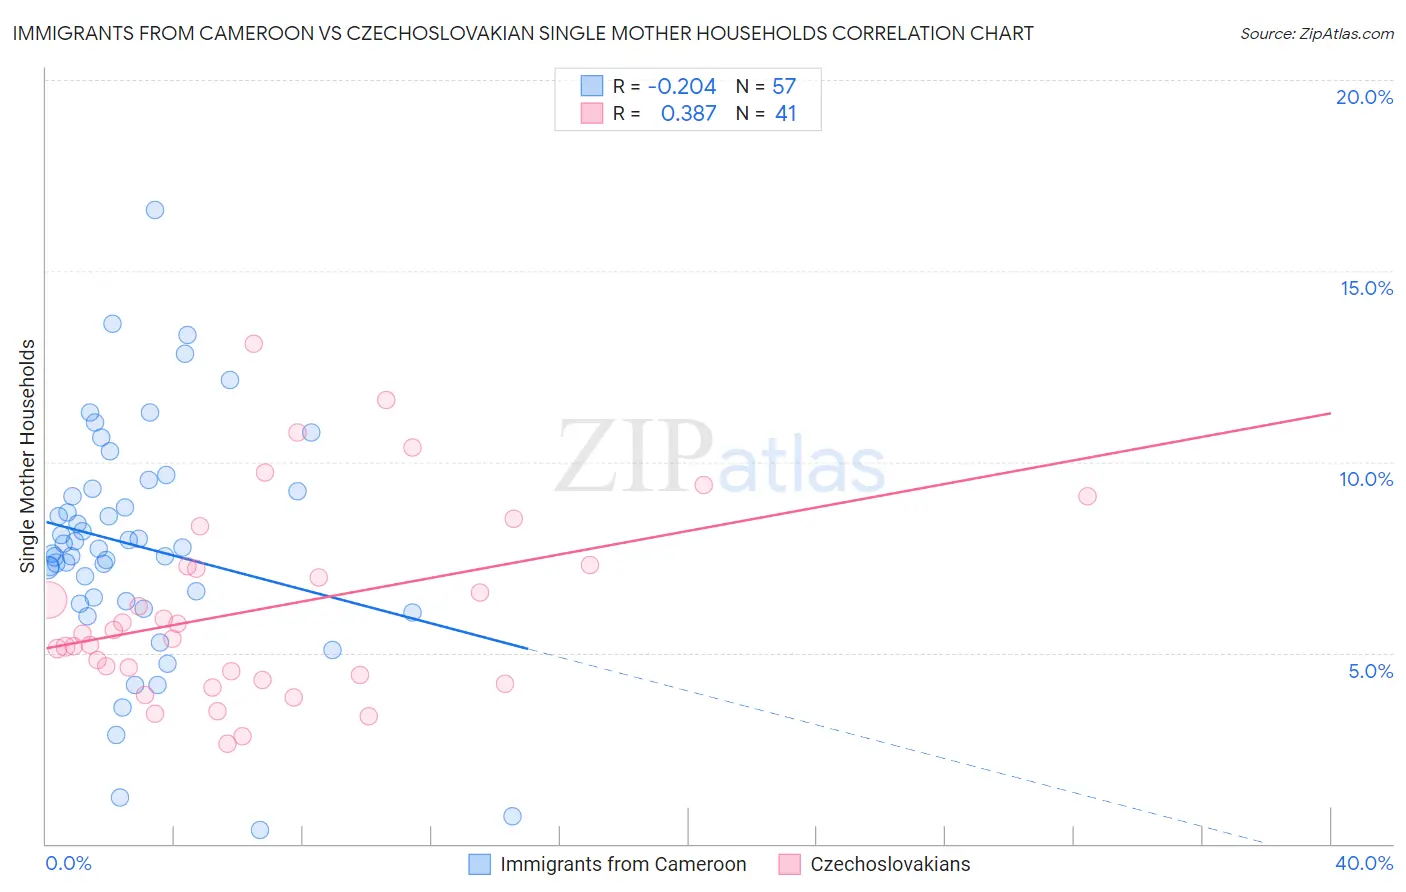
Immigrants from Cameroon vs Czechoslovakian Single Mother Households Correlation Chart
The statistical analysis conducted on geographies consisting of 130,708,507 people shows a weak negative correlation between the proportion of Immigrants from Cameroon and percentage of single mother households in the United States with a correlation coefficient (R) of -0.204 and weighted average of 7.9%. Similarly, the statistical analysis conducted on geographies consisting of 367,454,114 people shows a mild positive correlation between the proportion of Czechoslovakians and percentage of single mother households in the United States with a correlation coefficient (R) of 0.387 and weighted average of 5.9%, a difference of 33.8%.
Single Mother Households Correlation Summary
| Measurement | Immigrants from Cameroon | Czechoslovakian |
| Minimum | 0.36% | 2.6% |
| Maximum | 16.6% | 13.1% |
| Range | 16.2% | 10.5% |
| Mean | 7.8% | 6.2% |
| Median | 7.7% | 5.5% |
| Interquartile 25% (IQ1) | 6.3% | 4.3% |
| Interquartile 75% (IQ3) | 9.3% | 7.3% |
| Interquartile Range (IQR) | 2.9% | 2.9% |
| Standard Deviation (Sample) | 3.0% | 2.5% |
| Standard Deviation (Population) | 3.0% | 2.5% |
Similar Demographics by Single Mother Households
Demographics Similar to Immigrants from Cameroon by Single Mother Households
In terms of single mother households, the demographic groups most similar to Immigrants from Cameroon are Apache (7.9%, a difference of 0.10%), Ghanaian (7.8%, a difference of 0.36%), West Indian (7.8%, a difference of 0.37%), Barbadian (7.9%, a difference of 0.39%), and Immigrants from Nigeria (7.8%, a difference of 0.45%).
| Demographics | Rating | Rank | Single Mother Households |
| Immigrants | Middle Africa | 0.0 /100 | #286 | Tragic 7.7% |
| Immigrants | Guatemala | 0.0 /100 | #287 | Tragic 7.7% |
| Sierra Leoneans | 0.0 /100 | #288 | Tragic 7.7% |
| Sub-Saharan Africans | 0.0 /100 | #289 | Tragic 7.8% |
| Immigrants | Nigeria | 0.0 /100 | #290 | Tragic 7.8% |
| West Indians | 0.0 /100 | #291 | Tragic 7.8% |
| Ghanaians | 0.0 /100 | #292 | Tragic 7.8% |
| Immigrants | Cameroon | 0.0 /100 | #293 | Tragic 7.9% |
| Apache | 0.0 /100 | #294 | Tragic 7.9% |
| Barbadians | 0.0 /100 | #295 | Tragic 7.9% |
| Immigrants | Latin America | 0.0 /100 | #296 | Tragic 7.9% |
| Hispanics or Latinos | 0.0 /100 | #297 | Tragic 7.9% |
| Immigrants | West Indies | 0.0 /100 | #298 | Tragic 7.9% |
| Houma | 0.0 /100 | #299 | Tragic 7.9% |
| Mexicans | 0.0 /100 | #300 | Tragic 8.0% |
Demographics Similar to Czechoslovakians by Single Mother Households
In terms of single mother households, the demographic groups most similar to Czechoslovakians are Immigrants from Bolivia (5.9%, a difference of 0.010%), Palestinian (5.9%, a difference of 0.040%), Lebanese (5.9%, a difference of 0.080%), Welsh (5.9%, a difference of 0.27%), and Slavic (5.9%, a difference of 0.29%).
| Demographics | Rating | Rank | Single Mother Households |
| Argentineans | 93.7 /100 | #121 | Exceptional 5.8% |
| Belgians | 93.5 /100 | #122 | Exceptional 5.8% |
| Immigrants | Uzbekistan | 93.4 /100 | #123 | Exceptional 5.9% |
| Immigrants | Argentina | 93.2 /100 | #124 | Exceptional 5.9% |
| Slavs | 92.9 /100 | #125 | Exceptional 5.9% |
| Welsh | 92.8 /100 | #126 | Exceptional 5.9% |
| Lebanese | 92.4 /100 | #127 | Exceptional 5.9% |
| Czechoslovakians | 92.2 /100 | #128 | Exceptional 5.9% |
| Immigrants | Bolivia | 92.2 /100 | #129 | Exceptional 5.9% |
| Palestinians | 92.1 /100 | #130 | Exceptional 5.9% |
| Immigrants | Spain | 91.2 /100 | #131 | Exceptional 5.9% |
| Albanians | 91.1 /100 | #132 | Exceptional 5.9% |
| Egyptians | 90.7 /100 | #133 | Exceptional 5.9% |
| Canadians | 90.5 /100 | #134 | Exceptional 5.9% |
| Immigrants | Saudi Arabia | 90.2 /100 | #135 | Exceptional 5.9% |