Immigrants from Burma/Myanmar vs Sioux Currently Married
COMPARE
Immigrants from Burma/Myanmar
Sioux
Currently Married
Currently Married Comparison
Immigrants from Burma/Myanmar
Sioux
44.3%
CURRENTLY MARRIED
0.4/ 100
METRIC RATING
246th/ 347
METRIC RANK
41.9%
CURRENTLY MARRIED
0.0/ 100
METRIC RATING
303rd/ 347
METRIC RANK
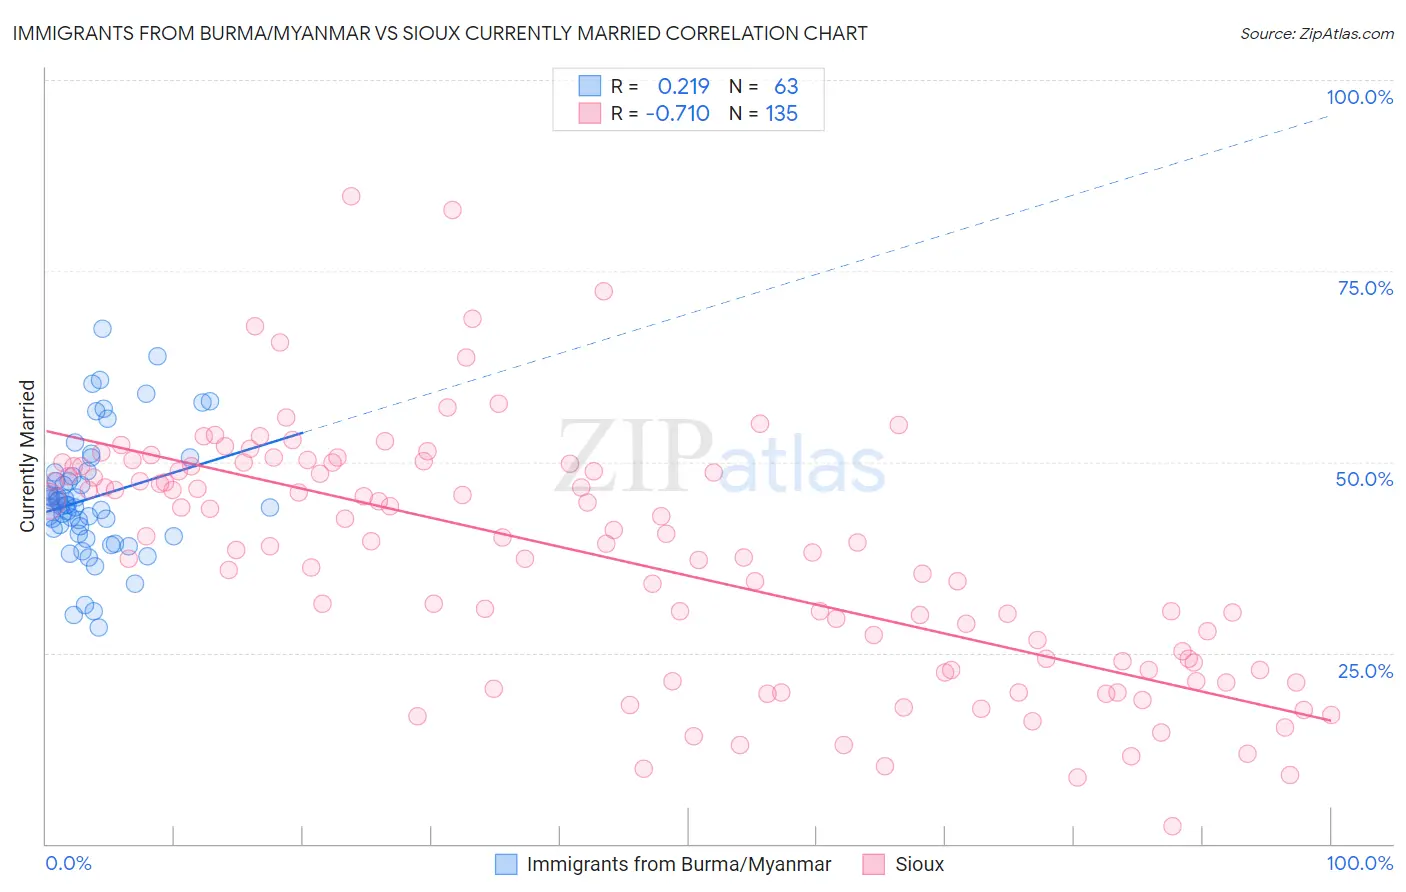
Immigrants from Burma/Myanmar vs Sioux Currently Married Correlation Chart
The statistical analysis conducted on geographies consisting of 172,355,169 people shows a weak positive correlation between the proportion of Immigrants from Burma/Myanmar and percentage of population currently married in the United States with a correlation coefficient (R) of 0.219 and weighted average of 44.3%. Similarly, the statistical analysis conducted on geographies consisting of 234,188,920 people shows a strong negative correlation between the proportion of Sioux and percentage of population currently married in the United States with a correlation coefficient (R) of -0.710 and weighted average of 41.9%, a difference of 5.6%.
Currently Married Correlation Summary
| Measurement | Immigrants from Burma/Myanmar | Sioux |
| Minimum | 28.3% | 2.3% |
| Maximum | 67.5% | 84.8% |
| Range | 39.2% | 82.5% |
| Mean | 45.3% | 37.5% |
| Median | 44.3% | 39.4% |
| Interquartile 25% (IQ1) | 40.6% | 22.8% |
| Interquartile 75% (IQ3) | 48.7% | 49.5% |
| Interquartile Range (IQR) | 8.0% | 26.7% |
| Standard Deviation (Sample) | 8.1% | 16.0% |
| Standard Deviation (Population) | 8.0% | 16.0% |
Similar Demographics by Currently Married
Demographics Similar to Immigrants from Burma/Myanmar by Currently Married
In terms of currently married, the demographic groups most similar to Immigrants from Burma/Myanmar are Immigrants from Armenia (44.3%, a difference of 0.070%), Ugandan (44.2%, a difference of 0.13%), Nicaraguan (44.2%, a difference of 0.22%), Immigrants from Cameroon (44.2%, a difference of 0.24%), and Immigrants from Eastern Africa (44.2%, a difference of 0.26%).
| Demographics | Rating | Rank | Currently Married |
| Immigrants | Mexico | 0.7 /100 | #239 | Tragic 44.5% |
| Mexican American Indians | 0.7 /100 | #240 | Tragic 44.5% |
| Ethiopians | 0.7 /100 | #241 | Tragic 44.5% |
| Immigrants | Cambodia | 0.7 /100 | #242 | Tragic 44.5% |
| Immigrants | Ethiopia | 0.7 /100 | #243 | Tragic 44.5% |
| Japanese | 0.6 /100 | #244 | Tragic 44.5% |
| Immigrants | Armenia | 0.4 /100 | #245 | Tragic 44.3% |
| Immigrants | Burma/Myanmar | 0.4 /100 | #246 | Tragic 44.3% |
| Ugandans | 0.4 /100 | #247 | Tragic 44.2% |
| Nicaraguans | 0.3 /100 | #248 | Tragic 44.2% |
| Immigrants | Cameroon | 0.3 /100 | #249 | Tragic 44.2% |
| Immigrants | Eastern Africa | 0.3 /100 | #250 | Tragic 44.2% |
| Blackfeet | 0.3 /100 | #251 | Tragic 44.2% |
| Hispanics or Latinos | 0.3 /100 | #252 | Tragic 44.1% |
| Immigrants | Central America | 0.3 /100 | #253 | Tragic 44.1% |
Demographics Similar to Sioux by Currently Married
In terms of currently married, the demographic groups most similar to Sioux are Immigrants from Zaire (42.0%, a difference of 0.010%), Immigrants from Bahamas (41.9%, a difference of 0.11%), Immigrants from Trinidad and Tobago (41.9%, a difference of 0.15%), Immigrants from Guyana (41.9%, a difference of 0.16%), and Immigrants from Yemen (42.1%, a difference of 0.26%).
| Demographics | Rating | Rank | Currently Married |
| Menominee | 0.0 /100 | #296 | Tragic 42.3% |
| Cheyenne | 0.0 /100 | #297 | Tragic 42.2% |
| Immigrants | Honduras | 0.0 /100 | #298 | Tragic 42.2% |
| Liberians | 0.0 /100 | #299 | Tragic 42.2% |
| Belizeans | 0.0 /100 | #300 | Tragic 42.2% |
| Immigrants | Yemen | 0.0 /100 | #301 | Tragic 42.1% |
| Immigrants | Zaire | 0.0 /100 | #302 | Tragic 42.0% |
| Sioux | 0.0 /100 | #303 | Tragic 41.9% |
| Immigrants | Bahamas | 0.0 /100 | #304 | Tragic 41.9% |
| Immigrants | Trinidad and Tobago | 0.0 /100 | #305 | Tragic 41.9% |
| Immigrants | Guyana | 0.0 /100 | #306 | Tragic 41.9% |
| Africans | 0.0 /100 | #307 | Tragic 41.8% |
| Immigrants | Belize | 0.0 /100 | #308 | Tragic 41.8% |
| Immigrants | Liberia | 0.0 /100 | #309 | Tragic 41.8% |
| Guyanese | 0.0 /100 | #310 | Tragic 41.6% |