Immigrants from Brazil vs Seminole Unemployment Among Ages 25 to 29 years
COMPARE
Immigrants from Brazil
Seminole
Unemployment Among Ages 25 to 29 years
Unemployment Among Ages 25 to 29 years Comparison
Immigrants from Brazil
Seminole
6.4%
UNEMPLOYMENT AMONG AGES 25 TO 29 YEARS
92.1/ 100
METRIC RATING
96th/ 347
METRIC RANK
7.2%
UNEMPLOYMENT AMONG AGES 25 TO 29 YEARS
0.6/ 100
METRIC RATING
249th/ 347
METRIC RANK
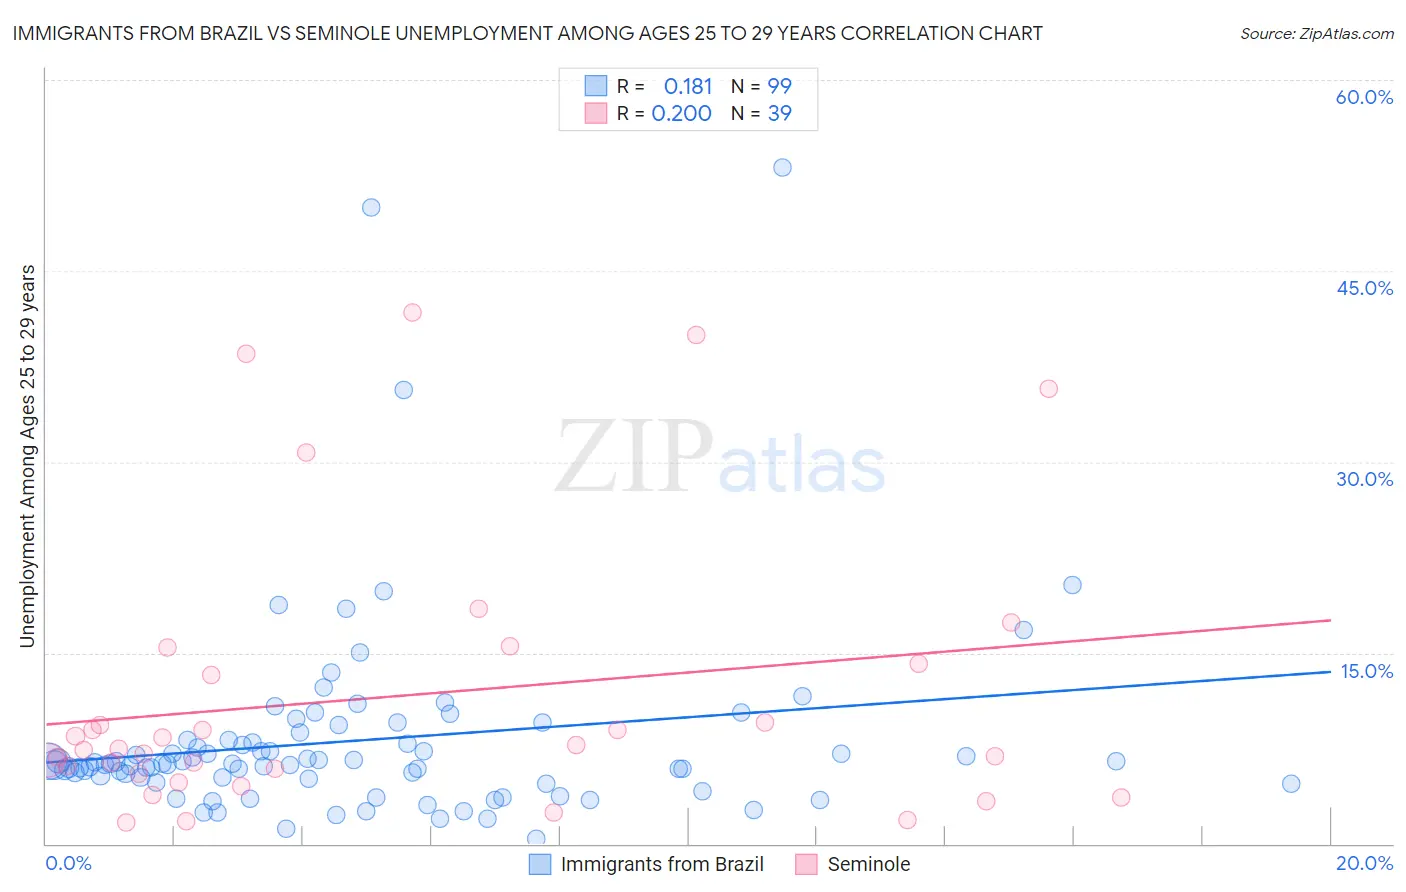
Immigrants from Brazil vs Seminole Unemployment Among Ages 25 to 29 years Correlation Chart
The statistical analysis conducted on geographies consisting of 328,493,482 people shows a poor positive correlation between the proportion of Immigrants from Brazil and unemployment rate among population between the ages 25 and 29 in the United States with a correlation coefficient (R) of 0.181 and weighted average of 6.4%. Similarly, the statistical analysis conducted on geographies consisting of 115,588,504 people shows a weak positive correlation between the proportion of Seminole and unemployment rate among population between the ages 25 and 29 in the United States with a correlation coefficient (R) of 0.200 and weighted average of 7.2%, a difference of 12.2%.
Unemployment Among Ages 25 to 29 years Correlation Summary
| Measurement | Immigrants from Brazil | Seminole |
| Minimum | 0.40% | 1.7% |
| Maximum | 53.1% | 41.7% |
| Range | 52.7% | 40.0% |
| Mean | 8.1% | 11.6% |
| Median | 6.3% | 7.5% |
| Interquartile 25% (IQ1) | 5.1% | 5.5% |
| Interquartile 75% (IQ3) | 8.1% | 14.1% |
| Interquartile Range (IQR) | 3.1% | 8.6% |
| Standard Deviation (Sample) | 7.9% | 10.9% |
| Standard Deviation (Population) | 7.8% | 10.8% |
Similar Demographics by Unemployment Among Ages 25 to 29 years
Demographics Similar to Immigrants from Brazil by Unemployment Among Ages 25 to 29 years
In terms of unemployment among ages 25 to 29 years, the demographic groups most similar to Immigrants from Brazil are Immigrants from Eastern Europe (6.4%, a difference of 0.060%), Afghan (6.4%, a difference of 0.080%), Serbian (6.4%, a difference of 0.090%), Iraqi (6.4%, a difference of 0.17%), and Uruguayan (6.4%, a difference of 0.20%).
| Demographics | Rating | Rank | Unemployment Among Ages 25 to 29 years |
| Immigrants | Oceania | 94.1 /100 | #89 | Exceptional 6.4% |
| Lebanese | 93.9 /100 | #90 | Exceptional 6.4% |
| Egyptians | 93.9 /100 | #91 | Exceptional 6.4% |
| Immigrants | North Macedonia | 93.6 /100 | #92 | Exceptional 6.4% |
| Australians | 93.6 /100 | #93 | Exceptional 6.4% |
| Zimbabweans | 93.5 /100 | #94 | Exceptional 6.4% |
| Afghans | 92.5 /100 | #95 | Exceptional 6.4% |
| Immigrants | Brazil | 92.1 /100 | #96 | Exceptional 6.4% |
| Immigrants | Eastern Europe | 91.9 /100 | #97 | Exceptional 6.4% |
| Serbians | 91.7 /100 | #98 | Exceptional 6.4% |
| Iraqis | 91.3 /100 | #99 | Exceptional 6.4% |
| Uruguayans | 91.2 /100 | #100 | Exceptional 6.4% |
| Immigrants | Ireland | 91.1 /100 | #101 | Exceptional 6.4% |
| British | 90.5 /100 | #102 | Exceptional 6.4% |
| Immigrants | Congo | 90.4 /100 | #103 | Exceptional 6.4% |
Demographics Similar to Seminole by Unemployment Among Ages 25 to 29 years
In terms of unemployment among ages 25 to 29 years, the demographic groups most similar to Seminole are Subsaharan African (7.2%, a difference of 0.020%), Delaware (7.2%, a difference of 0.16%), Immigrants from Guatemala (7.2%, a difference of 0.19%), Immigrants from Uzbekistan (7.2%, a difference of 0.20%), and Portuguese (7.2%, a difference of 0.22%).
| Demographics | Rating | Rank | Unemployment Among Ages 25 to 29 years |
| Spanish American Indians | 1.1 /100 | #242 | Tragic 7.1% |
| Yaqui | 1.0 /100 | #243 | Tragic 7.1% |
| Immigrants | Nonimmigrants | 0.9 /100 | #244 | Tragic 7.1% |
| Guatemalans | 0.9 /100 | #245 | Tragic 7.1% |
| Immigrants | Uzbekistan | 0.7 /100 | #246 | Tragic 7.2% |
| Immigrants | Guatemala | 0.7 /100 | #247 | Tragic 7.2% |
| Sub-Saharan Africans | 0.6 /100 | #248 | Tragic 7.2% |
| Seminole | 0.6 /100 | #249 | Tragic 7.2% |
| Delaware | 0.5 /100 | #250 | Tragic 7.2% |
| Portuguese | 0.5 /100 | #251 | Tragic 7.2% |
| Sierra Leoneans | 0.4 /100 | #252 | Tragic 7.2% |
| Immigrants | Portugal | 0.3 /100 | #253 | Tragic 7.2% |
| Ghanaians | 0.3 /100 | #254 | Tragic 7.2% |
| Immigrants | Cameroon | 0.3 /100 | #255 | Tragic 7.2% |
| Mexican American Indians | 0.3 /100 | #256 | Tragic 7.3% |