Immigrants from Brazil vs Immigrants from Iraq Married-couple Households
COMPARE
Immigrants from Brazil
Immigrants from Iraq
Married-couple Households
Married-couple Households Comparison
Immigrants from Brazil
Immigrants from Iraq
46.2%
MARRIED-COUPLE HOUSEHOLDS
38.3/ 100
METRIC RATING
183rd/ 347
METRIC RANK
47.3%
MARRIED-COUPLE HOUSEHOLDS
87.8/ 100
METRIC RATING
129th/ 347
METRIC RANK
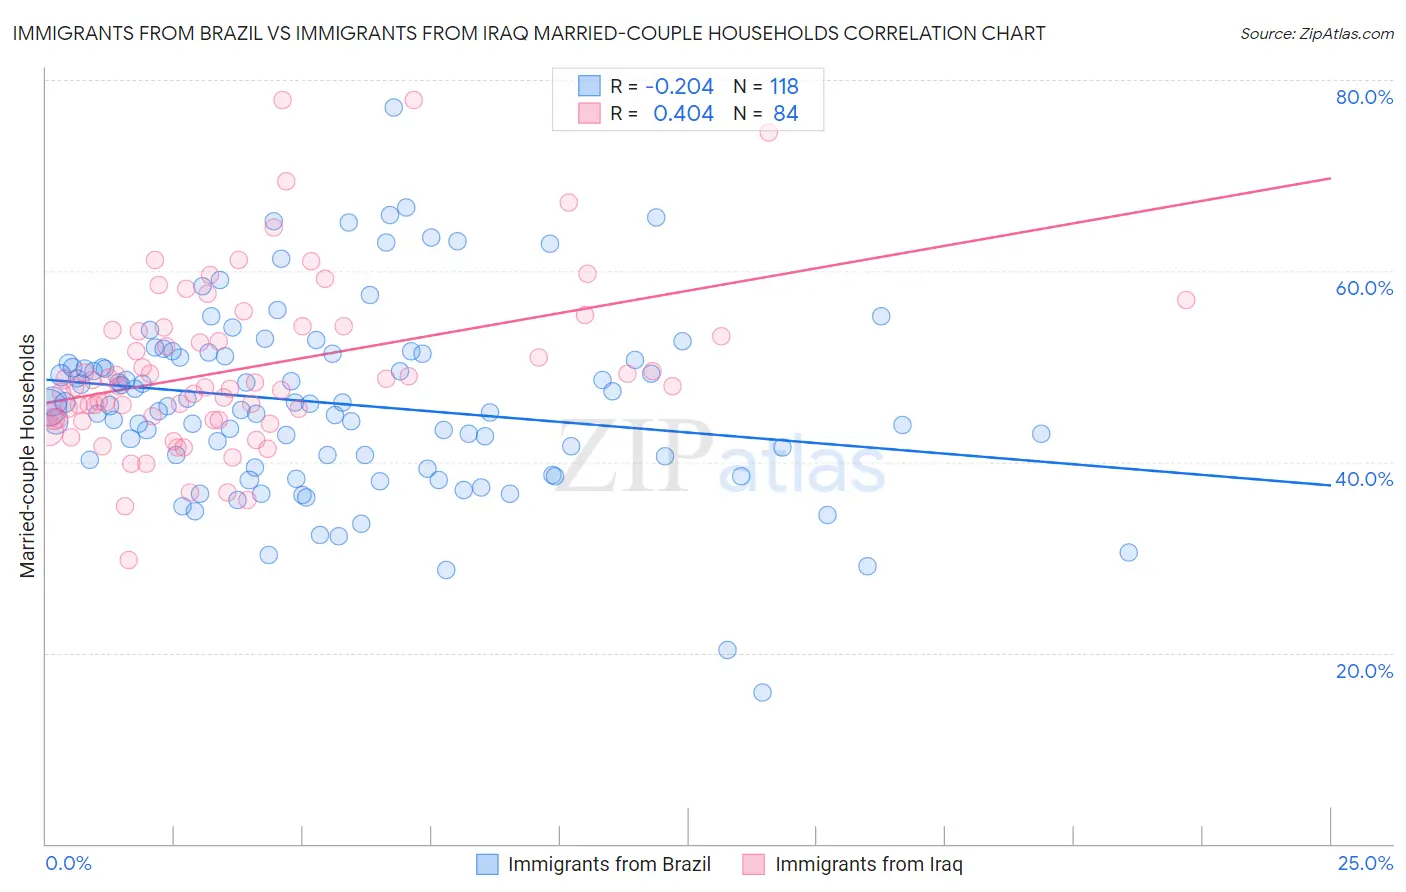
Immigrants from Brazil vs Immigrants from Iraq Married-couple Households Correlation Chart
The statistical analysis conducted on geographies consisting of 342,850,397 people shows a weak negative correlation between the proportion of Immigrants from Brazil and percentage of married-couple family households in the United States with a correlation coefficient (R) of -0.204 and weighted average of 46.2%. Similarly, the statistical analysis conducted on geographies consisting of 194,749,304 people shows a moderate positive correlation between the proportion of Immigrants from Iraq and percentage of married-couple family households in the United States with a correlation coefficient (R) of 0.404 and weighted average of 47.3%, a difference of 2.3%.
Married-couple Households Correlation Summary
| Measurement | Immigrants from Brazil | Immigrants from Iraq |
| Minimum | 15.8% | 29.8% |
| Maximum | 77.1% | 77.9% |
| Range | 61.3% | 48.1% |
| Mean | 46.1% | 49.8% |
| Median | 45.9% | 47.9% |
| Interquartile 25% (IQ1) | 40.2% | 44.5% |
| Interquartile 75% (IQ3) | 51.0% | 53.9% |
| Interquartile Range (IQR) | 10.8% | 9.4% |
| Standard Deviation (Sample) | 9.6% | 8.9% |
| Standard Deviation (Population) | 9.6% | 8.8% |
Similar Demographics by Married-couple Households
Demographics Similar to Immigrants from Brazil by Married-couple Households
In terms of married-couple households, the demographic groups most similar to Immigrants from Brazil are Yugoslavian (46.2%, a difference of 0.020%), Immigrants from Switzerland (46.2%, a difference of 0.060%), Brazilian (46.2%, a difference of 0.10%), Malaysian (46.3%, a difference of 0.14%), and Mongolian (46.3%, a difference of 0.15%).
| Demographics | Rating | Rank | Married-couple Households |
| Cajuns | 45.2 /100 | #176 | Average 46.4% |
| Immigrants | Immigrants | 43.8 /100 | #177 | Average 46.3% |
| Immigrants | Costa Rica | 43.4 /100 | #178 | Average 46.3% |
| Immigrants | Zimbabwe | 43.0 /100 | #179 | Average 46.3% |
| Mongolians | 42.0 /100 | #180 | Average 46.3% |
| Malaysians | 41.8 /100 | #181 | Average 46.3% |
| Yugoslavians | 38.9 /100 | #182 | Fair 46.2% |
| Immigrants | Brazil | 38.3 /100 | #183 | Fair 46.2% |
| Immigrants | Switzerland | 36.9 /100 | #184 | Fair 46.2% |
| Brazilians | 35.9 /100 | #185 | Fair 46.2% |
| Albanians | 31.1 /100 | #186 | Fair 46.1% |
| Fijians | 29.2 /100 | #187 | Fair 46.1% |
| South American Indians | 28.4 /100 | #188 | Fair 46.0% |
| Immigrants | Latvia | 26.9 /100 | #189 | Fair 46.0% |
| Immigrants | Kuwait | 25.6 /100 | #190 | Fair 46.0% |
Demographics Similar to Immigrants from Iraq by Married-couple Households
In terms of married-couple households, the demographic groups most similar to Immigrants from Iraq are Immigrants from Hungary (47.3%, a difference of 0.0%), Immigrants from Peru (47.3%, a difference of 0.010%), Immigrants from Denmark (47.3%, a difference of 0.020%), Celtic (47.3%, a difference of 0.030%), and Pakistani (47.3%, a difference of 0.070%).
| Demographics | Rating | Rank | Married-couple Households |
| Okinawans | 90.1 /100 | #122 | Exceptional 47.4% |
| Immigrants | Venezuela | 89.3 /100 | #123 | Excellent 47.4% |
| Zimbabweans | 89.2 /100 | #124 | Excellent 47.4% |
| Australians | 89.0 /100 | #125 | Excellent 47.4% |
| Pakistanis | 88.6 /100 | #126 | Excellent 47.3% |
| Celtics | 88.1 /100 | #127 | Excellent 47.3% |
| Immigrants | Peru | 87.9 /100 | #128 | Excellent 47.3% |
| Immigrants | Iraq | 87.8 /100 | #129 | Excellent 47.3% |
| Immigrants | Hungary | 87.8 /100 | #130 | Excellent 47.3% |
| Immigrants | Denmark | 87.5 /100 | #131 | Excellent 47.3% |
| Immigrants | Ukraine | 86.7 /100 | #132 | Excellent 47.3% |
| South Africans | 86.4 /100 | #133 | Excellent 47.3% |
| Immigrants | Greece | 86.0 /100 | #134 | Excellent 47.2% |
| Immigrants | Argentina | 86.0 /100 | #135 | Excellent 47.2% |
| New Zealanders | 85.3 /100 | #136 | Excellent 47.2% |