Immigrants from Belarus vs Albanian Family Households with Children
COMPARE
Immigrants from Belarus
Albanian
Family Households with Children
Family Households with Children Comparison
Immigrants from Belarus
Albanians
26.8%
FAMILY HOUSEHOLDS WITH CHILDREN
1.1/ 100
METRIC RATING
261st/ 347
METRIC RANK
26.5%
FAMILY HOUSEHOLDS WITH CHILDREN
0.2/ 100
METRIC RATING
290th/ 347
METRIC RANK
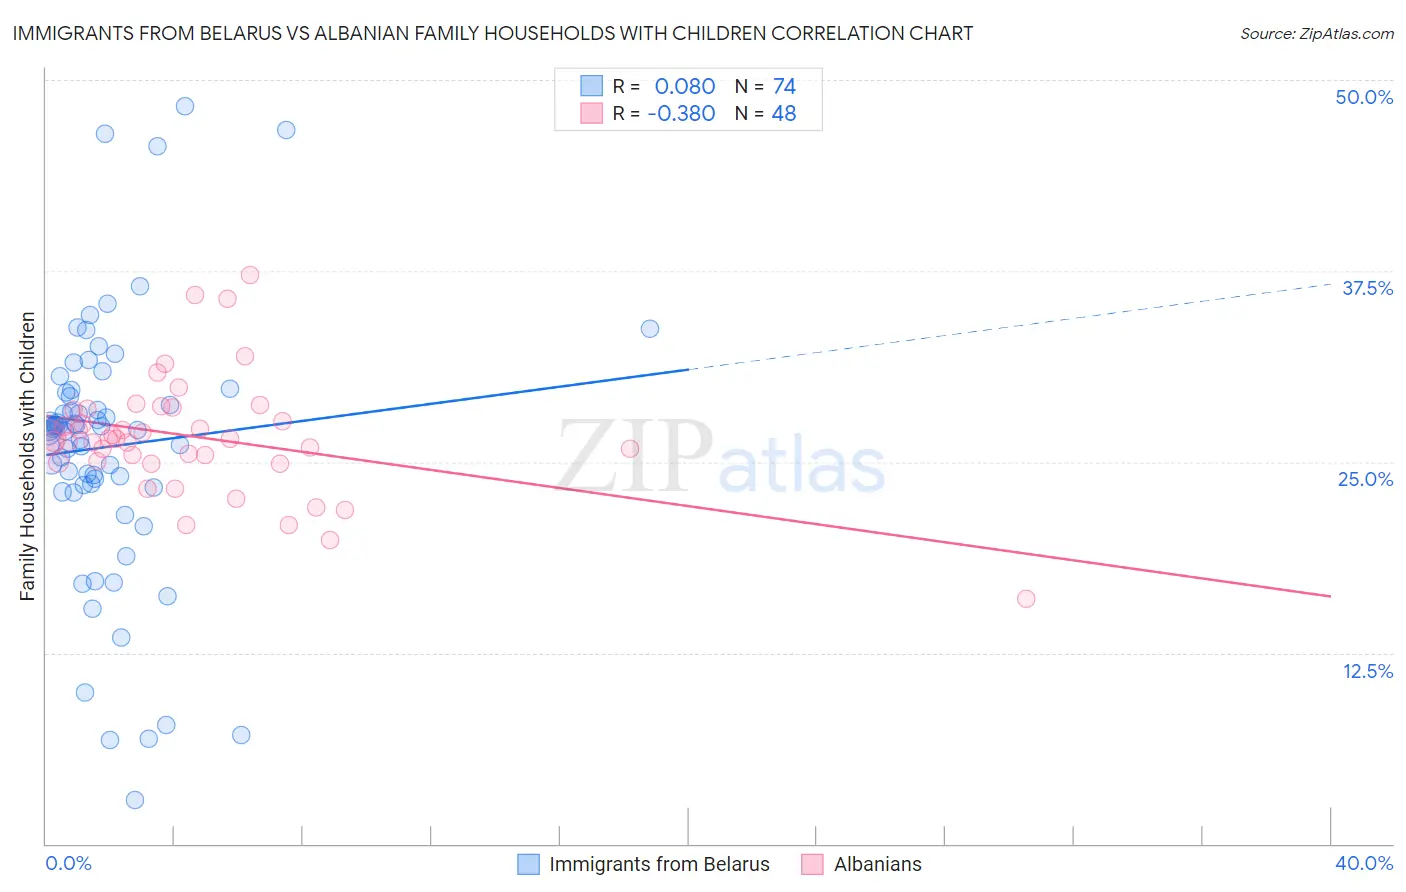
Immigrants from Belarus vs Albanian Family Households with Children Correlation Chart
The statistical analysis conducted on geographies consisting of 150,186,430 people shows a slight positive correlation between the proportion of Immigrants from Belarus and percentage of family households with children in the United States with a correlation coefficient (R) of 0.080 and weighted average of 26.8%. Similarly, the statistical analysis conducted on geographies consisting of 193,166,642 people shows a mild negative correlation between the proportion of Albanians and percentage of family households with children in the United States with a correlation coefficient (R) of -0.380 and weighted average of 26.5%, a difference of 1.1%.
Family Households with Children Correlation Summary
| Measurement | Immigrants from Belarus | Albanian |
| Minimum | 2.8% | 16.1% |
| Maximum | 48.3% | 37.3% |
| Range | 45.4% | 21.2% |
| Mean | 26.0% | 26.6% |
| Median | 27.2% | 26.5% |
| Interquartile 25% (IQ1) | 23.5% | 25.0% |
| Interquartile 75% (IQ3) | 29.5% | 28.4% |
| Interquartile Range (IQR) | 6.0% | 3.4% |
| Standard Deviation (Sample) | 8.6% | 3.9% |
| Standard Deviation (Population) | 8.6% | 3.8% |
Similar Demographics by Family Households with Children
Demographics Similar to Immigrants from Belarus by Family Households with Children
In terms of family households with children, the demographic groups most similar to Immigrants from Belarus are Immigrants from Jamaica (26.8%, a difference of 0.060%), Immigrants from Russia (26.8%, a difference of 0.060%), Immigrants from North Macedonia (26.7%, a difference of 0.060%), Immigrants from Lithuania (26.8%, a difference of 0.070%), and Taiwanese (26.7%, a difference of 0.090%).
| Demographics | Rating | Rank | Family Households with Children |
| Immigrants | Scotland | 1.5 /100 | #254 | Tragic 26.8% |
| German Russians | 1.5 /100 | #255 | Tragic 26.8% |
| Scotch-Irish | 1.4 /100 | #256 | Tragic 26.8% |
| Slavs | 1.3 /100 | #257 | Tragic 26.8% |
| Immigrants | Cuba | 1.3 /100 | #258 | Tragic 26.8% |
| Immigrants | Lithuania | 1.2 /100 | #259 | Tragic 26.8% |
| Immigrants | Jamaica | 1.2 /100 | #260 | Tragic 26.8% |
| Immigrants | Belarus | 1.1 /100 | #261 | Tragic 26.8% |
| Immigrants | Russia | 1.0 /100 | #262 | Tragic 26.8% |
| Immigrants | North Macedonia | 1.0 /100 | #263 | Tragic 26.7% |
| Taiwanese | 0.9 /100 | #264 | Tragic 26.7% |
| Chippewa | 0.9 /100 | #265 | Tragic 26.7% |
| Maltese | 0.9 /100 | #266 | Tragic 26.7% |
| Immigrants | Uzbekistan | 0.9 /100 | #267 | Tragic 26.7% |
| Immigrants | Belgium | 0.9 /100 | #268 | Tragic 26.7% |
Demographics Similar to Albanians by Family Households with Children
In terms of family households with children, the demographic groups most similar to Albanians are Bahamian (26.5%, a difference of 0.010%), Polish (26.5%, a difference of 0.010%), Black/African American (26.5%, a difference of 0.060%), Immigrants from Sweden (26.5%, a difference of 0.11%), and Latvian (26.4%, a difference of 0.12%).
| Demographics | Rating | Rank | Family Households with Children |
| Immigrants | North America | 0.3 /100 | #283 | Tragic 26.6% |
| Immigrants | Canada | 0.3 /100 | #284 | Tragic 26.5% |
| Cambodians | 0.2 /100 | #285 | Tragic 26.5% |
| Immigrants | Senegal | 0.2 /100 | #286 | Tragic 26.5% |
| Shoshone | 0.2 /100 | #287 | Tragic 26.5% |
| Russians | 0.2 /100 | #288 | Tragic 26.5% |
| Immigrants | Sweden | 0.2 /100 | #289 | Tragic 26.5% |
| Albanians | 0.2 /100 | #290 | Tragic 26.5% |
| Bahamians | 0.2 /100 | #291 | Tragic 26.5% |
| Poles | 0.2 /100 | #292 | Tragic 26.5% |
| Blacks/African Americans | 0.1 /100 | #293 | Tragic 26.5% |
| Latvians | 0.1 /100 | #294 | Tragic 26.4% |
| Macedonians | 0.1 /100 | #295 | Tragic 26.4% |
| Croatians | 0.1 /100 | #296 | Tragic 26.4% |
| Armenians | 0.1 /100 | #297 | Tragic 26.4% |