Immigrants from Bangladesh vs Immigrants from Eastern Africa Single Father Poverty
COMPARE
Immigrants from Bangladesh
Immigrants from Eastern Africa
Single Father Poverty
Single Father Poverty Comparison
Immigrants from Bangladesh
Immigrants from Eastern Africa
16.3%
SINGLE FATHER POVERTY
55.1/ 100
METRIC RATING
165th/ 347
METRIC RANK
14.7%
SINGLE FATHER POVERTY
100.0/ 100
METRIC RATING
37th/ 347
METRIC RANK
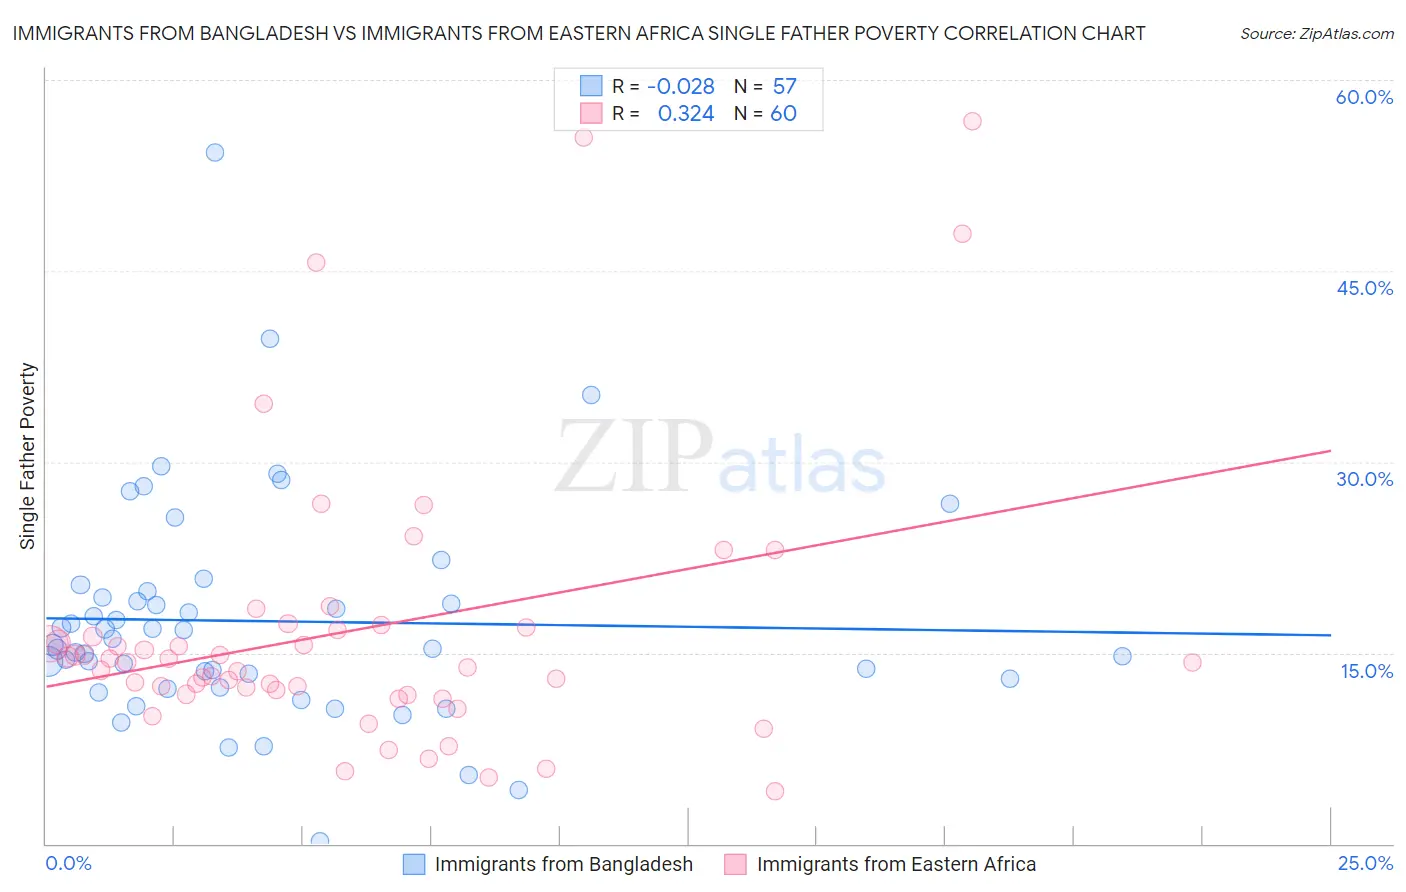
Immigrants from Bangladesh vs Immigrants from Eastern Africa Single Father Poverty Correlation Chart
The statistical analysis conducted on geographies consisting of 172,245,221 people shows no correlation between the proportion of Immigrants from Bangladesh and poverty level among single fathers in the United States with a correlation coefficient (R) of -0.028 and weighted average of 16.3%. Similarly, the statistical analysis conducted on geographies consisting of 287,393,274 people shows a mild positive correlation between the proportion of Immigrants from Eastern Africa and poverty level among single fathers in the United States with a correlation coefficient (R) of 0.324 and weighted average of 14.7%, a difference of 10.5%.
Single Father Poverty Correlation Summary
| Measurement | Immigrants from Bangladesh | Immigrants from Eastern Africa |
| Minimum | 0.23% | 4.1% |
| Maximum | 54.3% | 56.8% |
| Range | 54.0% | 52.7% |
| Mean | 17.5% | 16.7% |
| Median | 15.6% | 14.3% |
| Interquartile 25% (IQ1) | 12.6% | 11.9% |
| Interquartile 75% (IQ3) | 19.6% | 16.9% |
| Interquartile Range (IQR) | 6.9% | 5.0% |
| Standard Deviation (Sample) | 8.8% | 10.8% |
| Standard Deviation (Population) | 8.7% | 10.8% |
Similar Demographics by Single Father Poverty
Demographics Similar to Immigrants from Bangladesh by Single Father Poverty
In terms of single father poverty, the demographic groups most similar to Immigrants from Bangladesh are Guyanese (16.3%, a difference of 0.0%), Immigrants from Europe (16.3%, a difference of 0.010%), Immigrants from Costa Rica (16.3%, a difference of 0.030%), Ugandan (16.3%, a difference of 0.040%), and Yugoslavian (16.3%, a difference of 0.050%).
| Demographics | Rating | Rank | Single Father Poverty |
| Portuguese | 62.3 /100 | #158 | Good 16.2% |
| Belizeans | 59.9 /100 | #159 | Average 16.2% |
| Immigrants | Sudan | 59.8 /100 | #160 | Average 16.2% |
| Estonians | 56.7 /100 | #161 | Average 16.2% |
| Ugandans | 55.9 /100 | #162 | Average 16.3% |
| Immigrants | Costa Rica | 55.7 /100 | #163 | Average 16.3% |
| Guyanese | 55.2 /100 | #164 | Average 16.3% |
| Immigrants | Bangladesh | 55.1 /100 | #165 | Average 16.3% |
| Immigrants | Europe | 54.8 /100 | #166 | Average 16.3% |
| Yugoslavians | 53.9 /100 | #167 | Average 16.3% |
| Costa Ricans | 53.6 /100 | #168 | Average 16.3% |
| Northern Europeans | 52.8 /100 | #169 | Average 16.3% |
| Scandinavians | 52.3 /100 | #170 | Average 16.3% |
| Immigrants | Morocco | 50.7 /100 | #171 | Average 16.3% |
| Immigrants | Sierra Leone | 50.1 /100 | #172 | Average 16.3% |
Demographics Similar to Immigrants from Eastern Africa by Single Father Poverty
In terms of single father poverty, the demographic groups most similar to Immigrants from Eastern Africa are Bolivian (14.7%, a difference of 0.010%), Immigrants from Indonesia (14.7%, a difference of 0.13%), Immigrants from Asia (14.7%, a difference of 0.19%), Immigrants from Bolivia (14.7%, a difference of 0.29%), and Egyptian (14.7%, a difference of 0.36%).
| Demographics | Rating | Rank | Single Father Poverty |
| Thais | 100.0 /100 | #30 | Exceptional 14.5% |
| Icelanders | 100.0 /100 | #31 | Exceptional 14.5% |
| Asians | 100.0 /100 | #32 | Exceptional 14.6% |
| Okinawans | 100.0 /100 | #33 | Exceptional 14.6% |
| Egyptians | 100.0 /100 | #34 | Exceptional 14.7% |
| Immigrants | Bolivia | 100.0 /100 | #35 | Exceptional 14.7% |
| Immigrants | Indonesia | 100.0 /100 | #36 | Exceptional 14.7% |
| Immigrants | Eastern Africa | 100.0 /100 | #37 | Exceptional 14.7% |
| Bolivians | 100.0 /100 | #38 | Exceptional 14.7% |
| Immigrants | Asia | 100.0 /100 | #39 | Exceptional 14.7% |
| Pima | 100.0 /100 | #40 | Exceptional 14.8% |
| Indians (Asian) | 100.0 /100 | #41 | Exceptional 14.8% |
| Immigrants | Nepal | 100.0 /100 | #42 | Exceptional 14.8% |
| Immigrants | Eritrea | 100.0 /100 | #43 | Exceptional 14.8% |
| Salvadorans | 100.0 /100 | #44 | Exceptional 14.9% |