Immigrants from Bangladesh vs Immigrants from Italy Single Father Households
COMPARE
Immigrants from Bangladesh
Immigrants from Italy
Single Father Households
Single Father Households Comparison
Immigrants from Bangladesh
Immigrants from Italy
2.1%
SINGLE FATHER HOUSEHOLDS
99.8/ 100
METRIC RATING
73rd/ 347
METRIC RANK
2.1%
SINGLE FATHER HOUSEHOLDS
99.8/ 100
METRIC RATING
67th/ 347
METRIC RANK
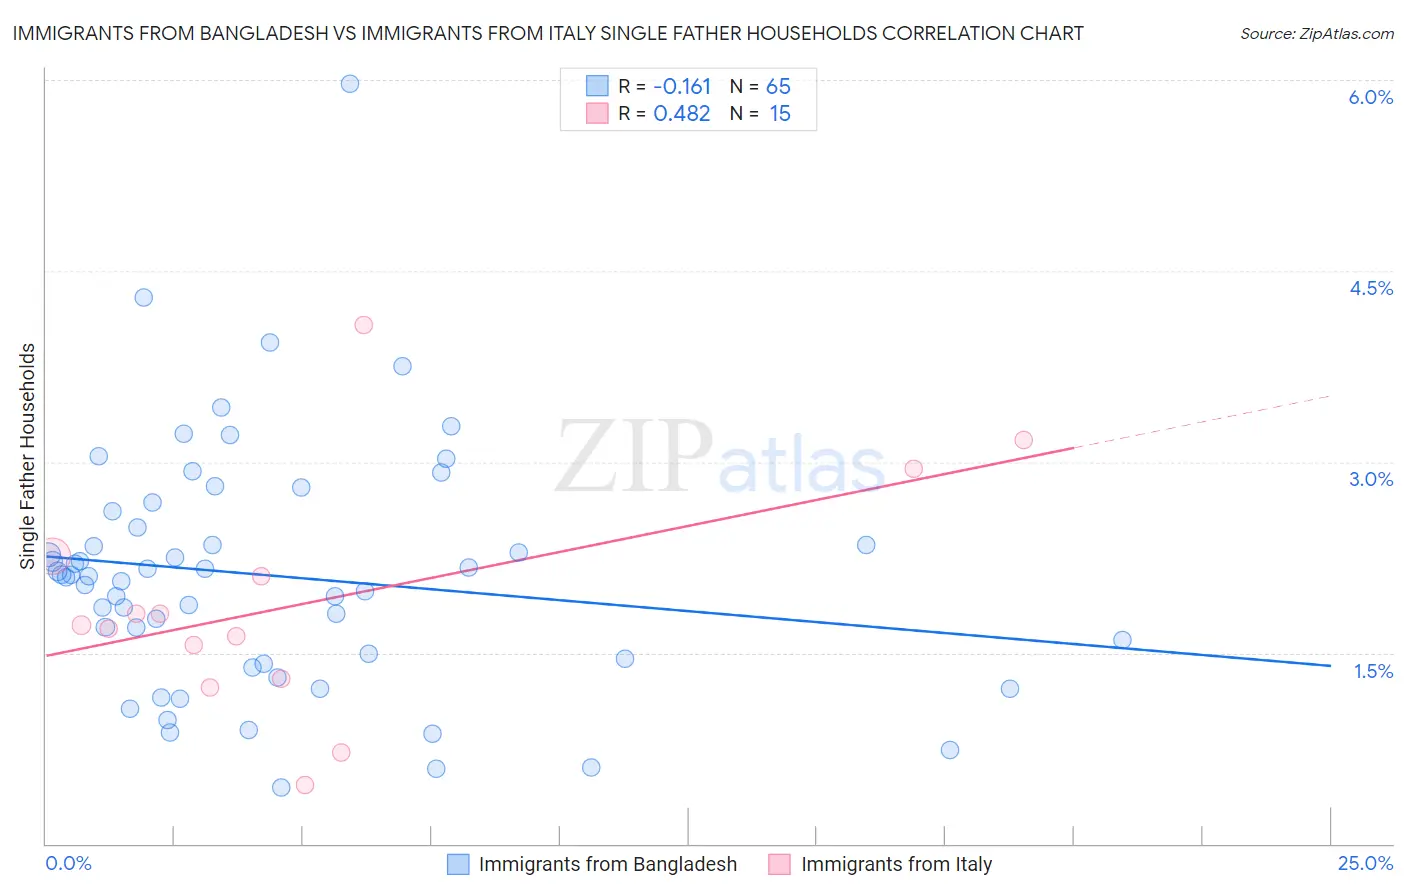
Immigrants from Bangladesh vs Immigrants from Italy Single Father Households Correlation Chart
The statistical analysis conducted on geographies consisting of 202,870,334 people shows a poor negative correlation between the proportion of Immigrants from Bangladesh and percentage of single father households in the United States with a correlation coefficient (R) of -0.161 and weighted average of 2.1%. Similarly, the statistical analysis conducted on geographies consisting of 321,207,929 people shows a moderate positive correlation between the proportion of Immigrants from Italy and percentage of single father households in the United States with a correlation coefficient (R) of 0.482 and weighted average of 2.1%, a difference of 0.48%.
Single Father Households Correlation Summary
| Measurement | Immigrants from Bangladesh | Immigrants from Italy |
| Minimum | 0.44% | 0.46% |
| Maximum | 6.0% | 4.1% |
| Range | 5.5% | 3.6% |
| Mean | 2.1% | 1.9% |
| Median | 2.1% | 1.7% |
| Interquartile 25% (IQ1) | 1.4% | 1.3% |
| Interquartile 75% (IQ3) | 2.5% | 2.3% |
| Interquartile Range (IQR) | 1.1% | 0.96% |
| Standard Deviation (Sample) | 0.96% | 0.93% |
| Standard Deviation (Population) | 0.96% | 0.90% |
Demographics Similar to Immigrants from Bangladesh and Immigrants from Italy by Single Father Households
In terms of single father households, the demographic groups most similar to Immigrants from Bangladesh are Immigrants from Egypt (2.1%, a difference of 0.0%), Immigrants from Spain (2.1%, a difference of 0.14%), Immigrants from Kuwait (2.1%, a difference of 0.15%), Egyptian (2.1%, a difference of 0.16%), and Immigrants from Sweden (2.1%, a difference of 0.29%). Similarly, the demographic groups most similar to Immigrants from Italy are Immigrants from Western Asia (2.1%, a difference of 0.050%), Immigrants from Denmark (2.1%, a difference of 0.090%), Immigrants from Romania (2.1%, a difference of 0.11%), Egyptian (2.1%, a difference of 0.32%), and Immigrants from Kuwait (2.1%, a difference of 0.34%).
| Demographics | Rating | Rank | Single Father Households |
| Immigrants | Austria | 99.9 /100 | #60 | Exceptional 2.0% |
| Vietnamese | 99.9 /100 | #61 | Exceptional 2.0% |
| Immigrants | Malaysia | 99.9 /100 | #62 | Exceptional 2.0% |
| Maltese | 99.9 /100 | #63 | Exceptional 2.0% |
| Mongolians | 99.9 /100 | #64 | Exceptional 2.1% |
| Paraguayans | 99.9 /100 | #65 | Exceptional 2.1% |
| Immigrants | Western Asia | 99.8 /100 | #66 | Exceptional 2.1% |
| Immigrants | Italy | 99.8 /100 | #67 | Exceptional 2.1% |
| Immigrants | Denmark | 99.8 /100 | #68 | Exceptional 2.1% |
| Immigrants | Romania | 99.8 /100 | #69 | Exceptional 2.1% |
| Egyptians | 99.8 /100 | #70 | Exceptional 2.1% |
| Immigrants | Kuwait | 99.8 /100 | #71 | Exceptional 2.1% |
| Immigrants | Spain | 99.8 /100 | #72 | Exceptional 2.1% |
| Immigrants | Bangladesh | 99.8 /100 | #73 | Exceptional 2.1% |
| Immigrants | Egypt | 99.8 /100 | #74 | Exceptional 2.1% |
| Immigrants | Sweden | 99.8 /100 | #75 | Exceptional 2.1% |
| Immigrants | Scotland | 99.8 /100 | #76 | Exceptional 2.1% |
| Immigrants | Saudi Arabia | 99.8 /100 | #77 | Exceptional 2.1% |
| Estonians | 99.7 /100 | #78 | Exceptional 2.1% |
| Immigrants | Asia | 99.7 /100 | #79 | Exceptional 2.1% |
| Immigrants | South Africa | 99.7 /100 | #80 | Exceptional 2.1% |