Immigrants from Australia vs Cambodian Single Mother Households
COMPARE
Immigrants from Australia
Cambodian
Single Mother Households
Single Mother Households Comparison
Immigrants from Australia
Cambodians
5.1%
SINGLE MOTHER HOUSEHOLDS
99.9/ 100
METRIC RATING
14th/ 347
METRIC RANK
5.3%
SINGLE MOTHER HOUSEHOLDS
99.7/ 100
METRIC RATING
32nd/ 347
METRIC RANK
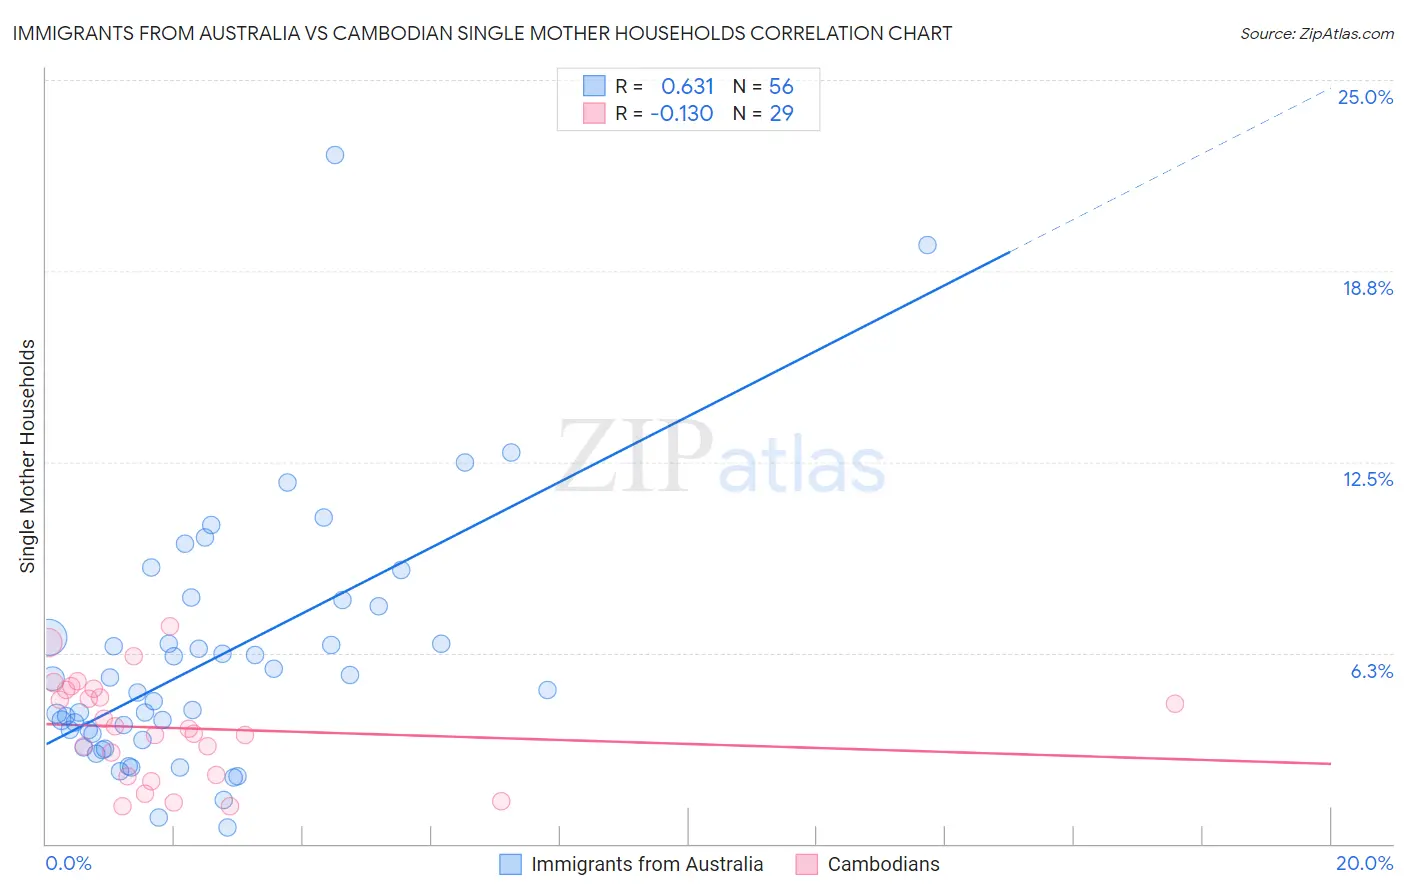
Immigrants from Australia vs Cambodian Single Mother Households Correlation Chart
The statistical analysis conducted on geographies consisting of 226,768,478 people shows a significant positive correlation between the proportion of Immigrants from Australia and percentage of single mother households in the United States with a correlation coefficient (R) of 0.631 and weighted average of 5.1%. Similarly, the statistical analysis conducted on geographies consisting of 102,433,936 people shows a poor negative correlation between the proportion of Cambodians and percentage of single mother households in the United States with a correlation coefficient (R) of -0.130 and weighted average of 5.3%, a difference of 3.8%.
Single Mother Households Correlation Summary
| Measurement | Immigrants from Australia | Cambodian |
| Minimum | 0.54% | 1.2% |
| Maximum | 22.6% | 7.1% |
| Range | 22.0% | 5.9% |
| Mean | 6.0% | 3.8% |
| Median | 5.0% | 3.8% |
| Interquartile 25% (IQ1) | 3.5% | 2.2% |
| Interquartile 75% (IQ3) | 7.3% | 5.1% |
| Interquartile Range (IQR) | 3.8% | 2.8% |
| Standard Deviation (Sample) | 4.1% | 1.6% |
| Standard Deviation (Population) | 4.1% | 1.6% |
Demographics Similar to Immigrants from Australia and Cambodians by Single Mother Households
In terms of single mother households, the demographic groups most similar to Immigrants from Australia are Immigrants from Eastern Asia (5.1%, a difference of 0.090%), Indian (Asian) (5.1%, a difference of 0.28%), Immigrants from India (5.1%, a difference of 0.32%), Soviet Union (5.1%, a difference of 0.49%), and Immigrants from Armenia (5.2%, a difference of 1.3%). Similarly, the demographic groups most similar to Cambodians are Burmese (5.3%, a difference of 0.010%), Immigrants from Korea (5.3%, a difference of 0.010%), Latvian (5.3%, a difference of 0.070%), Russian (5.3%, a difference of 0.090%), and Bhutanese (5.3%, a difference of 0.19%).
| Demographics | Rating | Rank | Single Mother Households |
| Immigrants | India | 99.9 /100 | #13 | Exceptional 5.1% |
| Immigrants | Australia | 99.9 /100 | #14 | Exceptional 5.1% |
| Immigrants | Eastern Asia | 99.9 /100 | #15 | Exceptional 5.1% |
| Indians (Asian) | 99.9 /100 | #16 | Exceptional 5.1% |
| Soviet Union | 99.9 /100 | #17 | Exceptional 5.1% |
| Immigrants | Armenia | 99.9 /100 | #18 | Exceptional 5.2% |
| Chinese | 99.9 /100 | #19 | Exceptional 5.2% |
| Maltese | 99.9 /100 | #20 | Exceptional 5.2% |
| Eastern Europeans | 99.8 /100 | #21 | Exceptional 5.2% |
| Thais | 99.8 /100 | #22 | Exceptional 5.2% |
| Immigrants | Austria | 99.8 /100 | #23 | Exceptional 5.2% |
| Armenians | 99.8 /100 | #24 | Exceptional 5.2% |
| Immigrants | Japan | 99.8 /100 | #25 | Exceptional 5.2% |
| Immigrants | Lithuania | 99.8 /100 | #26 | Exceptional 5.3% |
| Bhutanese | 99.7 /100 | #27 | Exceptional 5.3% |
| Russians | 99.7 /100 | #28 | Exceptional 5.3% |
| Latvians | 99.7 /100 | #29 | Exceptional 5.3% |
| Burmese | 99.7 /100 | #30 | Exceptional 5.3% |
| Immigrants | Korea | 99.7 /100 | #31 | Exceptional 5.3% |
| Cambodians | 99.7 /100 | #32 | Exceptional 5.3% |
| Immigrants | Switzerland | 99.7 /100 | #33 | Exceptional 5.3% |