Immigrants from Australia vs Hungarian 9th Grade
COMPARE
Immigrants from Australia
Hungarian
9th Grade
9th Grade Comparison
Immigrants from Australia
Hungarians
95.8%
9TH GRADE
99.5/ 100
METRIC RATING
70th/ 347
METRIC RANK
96.2%
9TH GRADE
100.0/ 100
METRIC RATING
34th/ 347
METRIC RANK
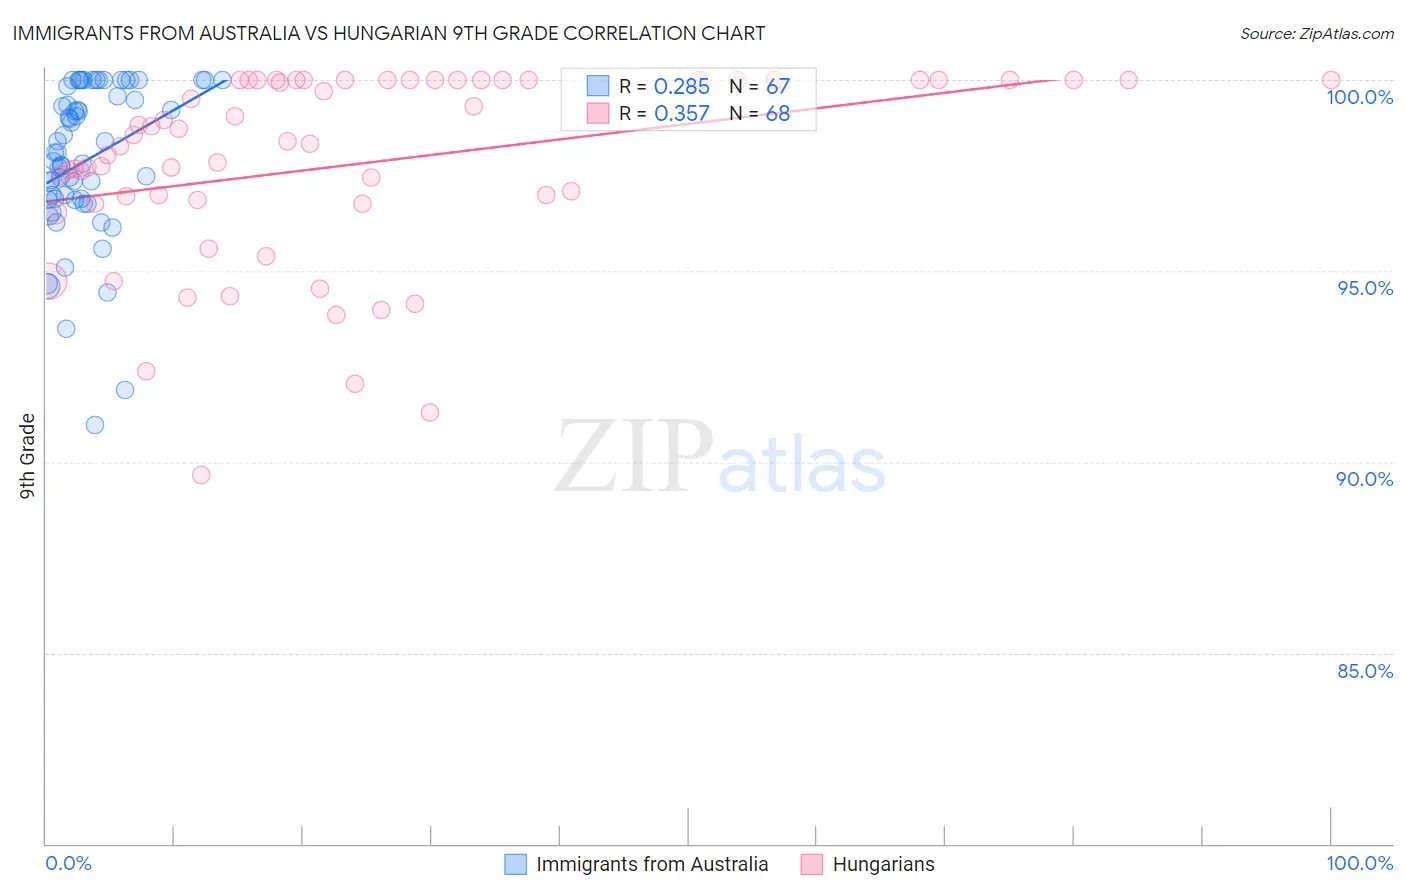
Immigrants from Australia vs Hungarian 9th Grade Correlation Chart
The statistical analysis conducted on geographies consisting of 227,202,602 people shows a weak positive correlation between the proportion of Immigrants from Australia and percentage of population with at least 9th grade education in the United States with a correlation coefficient (R) of 0.285 and weighted average of 95.8%. Similarly, the statistical analysis conducted on geographies consisting of 486,239,439 people shows a mild positive correlation between the proportion of Hungarians and percentage of population with at least 9th grade education in the United States with a correlation coefficient (R) of 0.357 and weighted average of 96.2%, a difference of 0.44%.
9th Grade Correlation Summary
| Measurement | Immigrants from Australia | Hungarian |
| Minimum | 91.0% | 89.7% |
| Maximum | 100.0% | 100.0% |
| Range | 9.0% | 10.3% |
| Mean | 97.9% | 97.8% |
| Median | 98.1% | 98.4% |
| Interquartile 25% (IQ1) | 96.9% | 96.8% |
| Interquartile 75% (IQ3) | 99.8% | 100.0% |
| Interquartile Range (IQR) | 3.0% | 3.2% |
| Standard Deviation (Sample) | 2.0% | 2.5% |
| Standard Deviation (Population) | 2.0% | 2.5% |
Similar Demographics by 9th Grade
Demographics Similar to Immigrants from Australia by 9th Grade
In terms of 9th grade, the demographic groups most similar to Immigrants from Australia are Immigrants from Belgium (95.8%, a difference of 0.010%), Turkish (95.8%, a difference of 0.010%), Immigrants from Singapore (95.8%, a difference of 0.010%), Thai (95.8%, a difference of 0.010%), and Cypriot (95.8%, a difference of 0.020%).
| Demographics | Rating | Rank | 9th Grade |
| Canadians | 99.7 /100 | #63 | Exceptional 95.9% |
| Zimbabweans | 99.7 /100 | #64 | Exceptional 95.9% |
| Immigrants | England | 99.6 /100 | #65 | Exceptional 95.9% |
| Immigrants | Netherlands | 99.6 /100 | #66 | Exceptional 95.8% |
| Cypriots | 99.6 /100 | #67 | Exceptional 95.8% |
| Immigrants | Ireland | 99.6 /100 | #68 | Exceptional 95.8% |
| Immigrants | Lithuania | 99.6 /100 | #69 | Exceptional 95.8% |
| Immigrants | Australia | 99.5 /100 | #70 | Exceptional 95.8% |
| Immigrants | Belgium | 99.5 /100 | #71 | Exceptional 95.8% |
| Turks | 99.5 /100 | #72 | Exceptional 95.8% |
| Immigrants | Singapore | 99.5 /100 | #73 | Exceptional 95.8% |
| Thais | 99.5 /100 | #74 | Exceptional 95.8% |
| Inupiat | 99.5 /100 | #75 | Exceptional 95.8% |
| Immigrants | Sweden | 99.5 /100 | #76 | Exceptional 95.8% |
| Whites/Caucasians | 99.4 /100 | #77 | Exceptional 95.8% |
Demographics Similar to Hungarians by 9th Grade
In terms of 9th grade, the demographic groups most similar to Hungarians are Luxembourger (96.3%, a difference of 0.030%), British (96.3%, a difference of 0.040%), Belgian (96.3%, a difference of 0.040%), Bulgarian (96.2%, a difference of 0.040%), and Northern European (96.2%, a difference of 0.040%).
| Demographics | Rating | Rank | 9th Grade |
| Scotch-Irish | 100.0 /100 | #27 | Exceptional 96.3% |
| Eastern Europeans | 100.0 /100 | #28 | Exceptional 96.3% |
| Chinese | 100.0 /100 | #29 | Exceptional 96.3% |
| Maltese | 100.0 /100 | #30 | Exceptional 96.3% |
| British | 100.0 /100 | #31 | Exceptional 96.3% |
| Belgians | 100.0 /100 | #32 | Exceptional 96.3% |
| Luxembourgers | 100.0 /100 | #33 | Exceptional 96.3% |
| Hungarians | 100.0 /100 | #34 | Exceptional 96.2% |
| Bulgarians | 99.9 /100 | #35 | Exceptional 96.2% |
| Northern Europeans | 99.9 /100 | #36 | Exceptional 96.2% |
| Estonians | 99.9 /100 | #37 | Exceptional 96.1% |
| Immigrants | Scotland | 99.9 /100 | #38 | Exceptional 96.1% |
| Ottawa | 99.9 /100 | #39 | Exceptional 96.1% |
| Slavs | 99.9 /100 | #40 | Exceptional 96.1% |
| Czechoslovakians | 99.9 /100 | #41 | Exceptional 96.1% |