Immigrants from Armenia vs Northern European Married-couple Households
COMPARE
Immigrants from Armenia
Northern European
Married-couple Households
Married-couple Households Comparison
Immigrants from Armenia
Northern Europeans
44.3%
MARRIED-COUPLE HOUSEHOLDS
0.7/ 100
METRIC RATING
244th/ 347
METRIC RANK
48.4%
MARRIED-COUPLE HOUSEHOLDS
99.0/ 100
METRIC RATING
64th/ 347
METRIC RANK
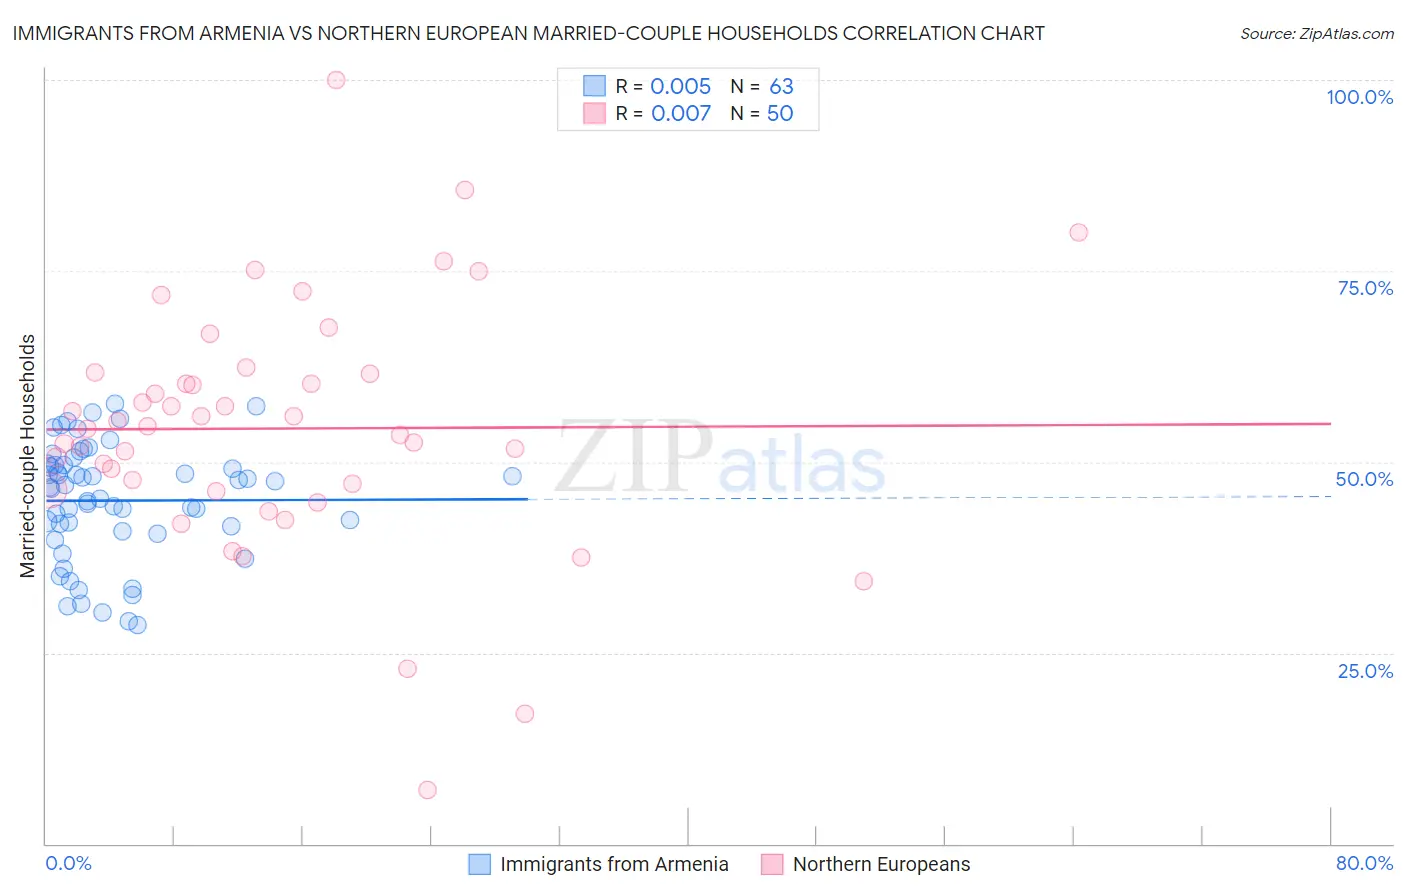
Immigrants from Armenia vs Northern European Married-couple Households Correlation Chart
The statistical analysis conducted on geographies consisting of 97,683,198 people shows no correlation between the proportion of Immigrants from Armenia and percentage of married-couple family households in the United States with a correlation coefficient (R) of 0.005 and weighted average of 44.3%. Similarly, the statistical analysis conducted on geographies consisting of 405,935,779 people shows no correlation between the proportion of Northern Europeans and percentage of married-couple family households in the United States with a correlation coefficient (R) of 0.007 and weighted average of 48.4%, a difference of 9.4%.
Married-couple Households Correlation Summary
| Measurement | Immigrants from Armenia | Northern European |
| Minimum | 28.6% | 7.1% |
| Maximum | 57.7% | 100.0% |
| Range | 29.0% | 92.9% |
| Mean | 44.9% | 54.4% |
| Median | 46.7% | 54.5% |
| Interquartile 25% (IQ1) | 41.0% | 46.4% |
| Interquartile 75% (IQ3) | 49.6% | 61.6% |
| Interquartile Range (IQR) | 8.7% | 15.2% |
| Standard Deviation (Sample) | 7.5% | 16.3% |
| Standard Deviation (Population) | 7.4% | 16.1% |
Similar Demographics by Married-couple Households
Demographics Similar to Immigrants from Armenia by Married-couple Households
In terms of married-couple households, the demographic groups most similar to Immigrants from Armenia are Immigrants from El Salvador (44.3%, a difference of 0.010%), Immigrants from Cuba (44.2%, a difference of 0.16%), Immigrants from Morocco (44.2%, a difference of 0.16%), Immigrants from Saudi Arabia (44.4%, a difference of 0.28%), and Immigrants from Albania (44.4%, a difference of 0.35%).
| Demographics | Rating | Rank | Married-couple Households |
| Comanche | 1.2 /100 | #237 | Tragic 44.5% |
| Immigrants | Uruguay | 1.1 /100 | #238 | Tragic 44.5% |
| Spanish Americans | 1.1 /100 | #239 | Tragic 44.5% |
| Ute | 1.0 /100 | #240 | Tragic 44.4% |
| Immigrants | Bosnia and Herzegovina | 1.0 /100 | #241 | Tragic 44.4% |
| Immigrants | Albania | 1.0 /100 | #242 | Tragic 44.4% |
| Immigrants | Saudi Arabia | 0.9 /100 | #243 | Tragic 44.4% |
| Immigrants | Armenia | 0.7 /100 | #244 | Tragic 44.3% |
| Immigrants | El Salvador | 0.7 /100 | #245 | Tragic 44.3% |
| Immigrants | Cuba | 0.6 /100 | #246 | Tragic 44.2% |
| Immigrants | Morocco | 0.6 /100 | #247 | Tragic 44.2% |
| Yup'ik | 0.4 /100 | #248 | Tragic 44.1% |
| Immigrants | Kenya | 0.4 /100 | #249 | Tragic 44.1% |
| French American Indians | 0.4 /100 | #250 | Tragic 44.1% |
| German Russians | 0.4 /100 | #251 | Tragic 44.0% |
Demographics Similar to Northern Europeans by Married-couple Households
In terms of married-couple households, the demographic groups most similar to Northern Europeans are Basque (48.4%, a difference of 0.010%), Immigrants from Canada (48.4%, a difference of 0.020%), Jordanian (48.4%, a difference of 0.040%), Romanian (48.4%, a difference of 0.050%), and Immigrants from South Eastern Asia (48.4%, a difference of 0.060%).
| Demographics | Rating | Rank | Married-couple Households |
| Poles | 99.2 /100 | #57 | Exceptional 48.5% |
| Immigrants | Indonesia | 99.2 /100 | #58 | Exceptional 48.5% |
| Czechoslovakians | 99.2 /100 | #59 | Exceptional 48.5% |
| Croatians | 99.1 /100 | #60 | Exceptional 48.5% |
| Bulgarians | 99.1 /100 | #61 | Exceptional 48.5% |
| Luxembourgers | 99.1 /100 | #62 | Exceptional 48.5% |
| Basques | 99.0 /100 | #63 | Exceptional 48.4% |
| Northern Europeans | 99.0 /100 | #64 | Exceptional 48.4% |
| Immigrants | Canada | 99.0 /100 | #65 | Exceptional 48.4% |
| Jordanians | 98.9 /100 | #66 | Exceptional 48.4% |
| Romanians | 98.9 /100 | #67 | Exceptional 48.4% |
| Immigrants | South Eastern Asia | 98.9 /100 | #68 | Exceptional 48.4% |
| Immigrants | China | 98.9 /100 | #69 | Exceptional 48.4% |
| Immigrants | North America | 98.9 /100 | #70 | Exceptional 48.4% |
| Laotians | 98.8 /100 | #71 | Exceptional 48.4% |