Immigrants from Albania vs Immigrants from Portugal Single Mother Households
COMPARE
Immigrants from Albania
Immigrants from Portugal
Single Mother Households
Single Mother Households Comparison
Immigrants from Albania
Immigrants from Portugal
6.1%
SINGLE MOTHER HOUSEHOLDS
81.5/ 100
METRIC RATING
149th/ 347
METRIC RANK
7.2%
SINGLE MOTHER HOUSEHOLDS
0.6/ 100
METRIC RATING
241st/ 347
METRIC RANK
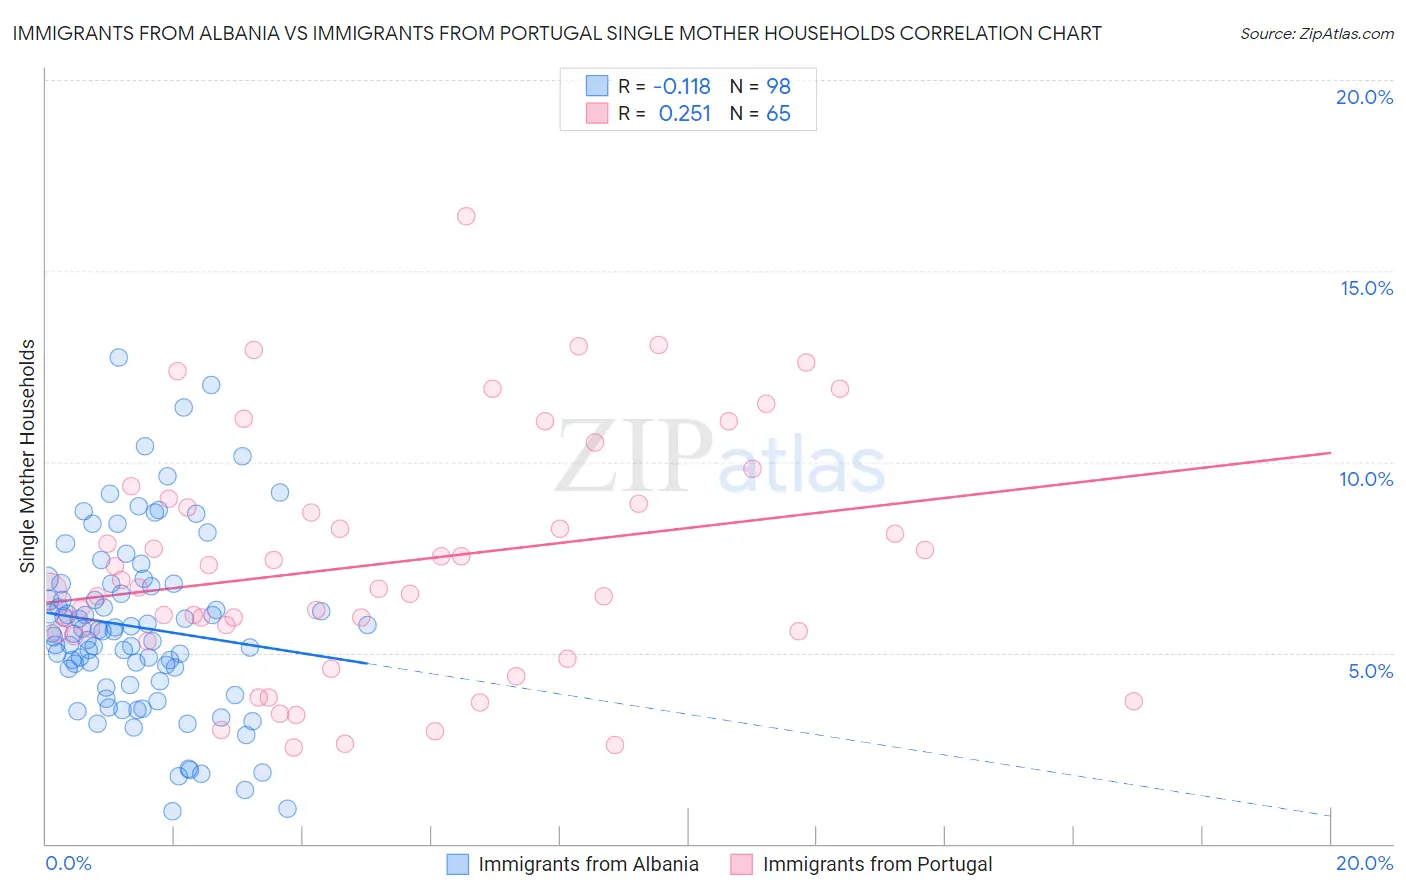
Immigrants from Albania vs Immigrants from Portugal Single Mother Households Correlation Chart
The statistical analysis conducted on geographies consisting of 119,328,901 people shows a poor negative correlation between the proportion of Immigrants from Albania and percentage of single mother households in the United States with a correlation coefficient (R) of -0.118 and weighted average of 6.1%. Similarly, the statistical analysis conducted on geographies consisting of 174,517,649 people shows a weak positive correlation between the proportion of Immigrants from Portugal and percentage of single mother households in the United States with a correlation coefficient (R) of 0.251 and weighted average of 7.2%, a difference of 18.7%.
Single Mother Households Correlation Summary
| Measurement | Immigrants from Albania | Immigrants from Portugal |
| Minimum | 0.85% | 2.5% |
| Maximum | 12.7% | 16.4% |
| Range | 11.9% | 13.9% |
| Mean | 5.7% | 7.3% |
| Median | 5.5% | 6.7% |
| Interquartile 25% (IQ1) | 4.2% | 5.5% |
| Interquartile 75% (IQ3) | 6.8% | 9.0% |
| Interquartile Range (IQR) | 2.6% | 3.5% |
| Standard Deviation (Sample) | 2.3% | 3.1% |
| Standard Deviation (Population) | 2.3% | 3.1% |
Similar Demographics by Single Mother Households
Demographics Similar to Immigrants from Albania by Single Mother Households
In terms of single mother households, the demographic groups most similar to Immigrants from Albania are Scotch-Irish (6.0%, a difference of 0.10%), Zimbabwean (6.1%, a difference of 0.14%), Immigrants from Jordan (6.0%, a difference of 0.15%), Immigrants from Southern Europe (6.1%, a difference of 0.19%), and French Canadian (6.0%, a difference of 0.21%).
| Demographics | Rating | Rank | Single Mother Households |
| Immigrants | Egypt | 85.0 /100 | #142 | Excellent 6.0% |
| Immigrants | Iraq | 84.8 /100 | #143 | Excellent 6.0% |
| Koreans | 84.4 /100 | #144 | Excellent 6.0% |
| Arabs | 84.0 /100 | #145 | Excellent 6.0% |
| French Canadians | 82.6 /100 | #146 | Excellent 6.0% |
| Immigrants | Jordan | 82.3 /100 | #147 | Excellent 6.0% |
| Scotch-Irish | 82.0 /100 | #148 | Excellent 6.0% |
| Immigrants | Albania | 81.5 /100 | #149 | Excellent 6.1% |
| Zimbabweans | 80.7 /100 | #150 | Excellent 6.1% |
| Immigrants | Southern Europe | 80.5 /100 | #151 | Excellent 6.1% |
| Pakistanis | 79.2 /100 | #152 | Good 6.1% |
| Immigrants | Brazil | 78.9 /100 | #153 | Good 6.1% |
| Immigrants | Philippines | 78.5 /100 | #154 | Good 6.1% |
| Whites/Caucasians | 76.5 /100 | #155 | Good 6.1% |
| Native Hawaiians | 75.0 /100 | #156 | Good 6.1% |
Demographics Similar to Immigrants from Portugal by Single Mother Households
In terms of single mother households, the demographic groups most similar to Immigrants from Portugal are Fijian (7.2%, a difference of 0.080%), Ecuadorian (7.2%, a difference of 0.13%), Cuban (7.2%, a difference of 0.19%), Immigrants from Panama (7.2%, a difference of 0.35%), and Immigrants from Cambodia (7.2%, a difference of 0.54%).
| Demographics | Rating | Rank | Single Mother Households |
| Chickasaw | 1.4 /100 | #234 | Tragic 7.0% |
| Immigrants | Burma/Myanmar | 1.4 /100 | #235 | Tragic 7.0% |
| Ute | 1.0 /100 | #236 | Tragic 7.1% |
| Arapaho | 1.0 /100 | #237 | Tragic 7.1% |
| Panamanians | 0.9 /100 | #238 | Tragic 7.1% |
| Kiowa | 0.8 /100 | #239 | Tragic 7.1% |
| Immigrants | Panama | 0.7 /100 | #240 | Tragic 7.2% |
| Immigrants | Portugal | 0.6 /100 | #241 | Tragic 7.2% |
| Fijians | 0.6 /100 | #242 | Tragic 7.2% |
| Ecuadorians | 0.6 /100 | #243 | Tragic 7.2% |
| Cubans | 0.6 /100 | #244 | Tragic 7.2% |
| Immigrants | Cambodia | 0.5 /100 | #245 | Tragic 7.2% |
| Nicaraguans | 0.5 /100 | #246 | Tragic 7.2% |
| Dutch West Indians | 0.4 /100 | #247 | Tragic 7.3% |
| Spanish American Indians | 0.4 /100 | #248 | Tragic 7.3% |