Immigrants from Africa vs Immigrants from Syria Average Family Size
COMPARE
Immigrants from Africa
Immigrants from Syria
Average Family Size
Average Family Size Comparison
Immigrants from Africa
Immigrants from Syria
3.25
AVERAGE FAMILY SIZE
77.9/ 100
METRIC RATING
146th/ 347
METRIC RANK
3.26
AVERAGE FAMILY SIZE
90.6/ 100
METRIC RATING
127th/ 347
METRIC RANK
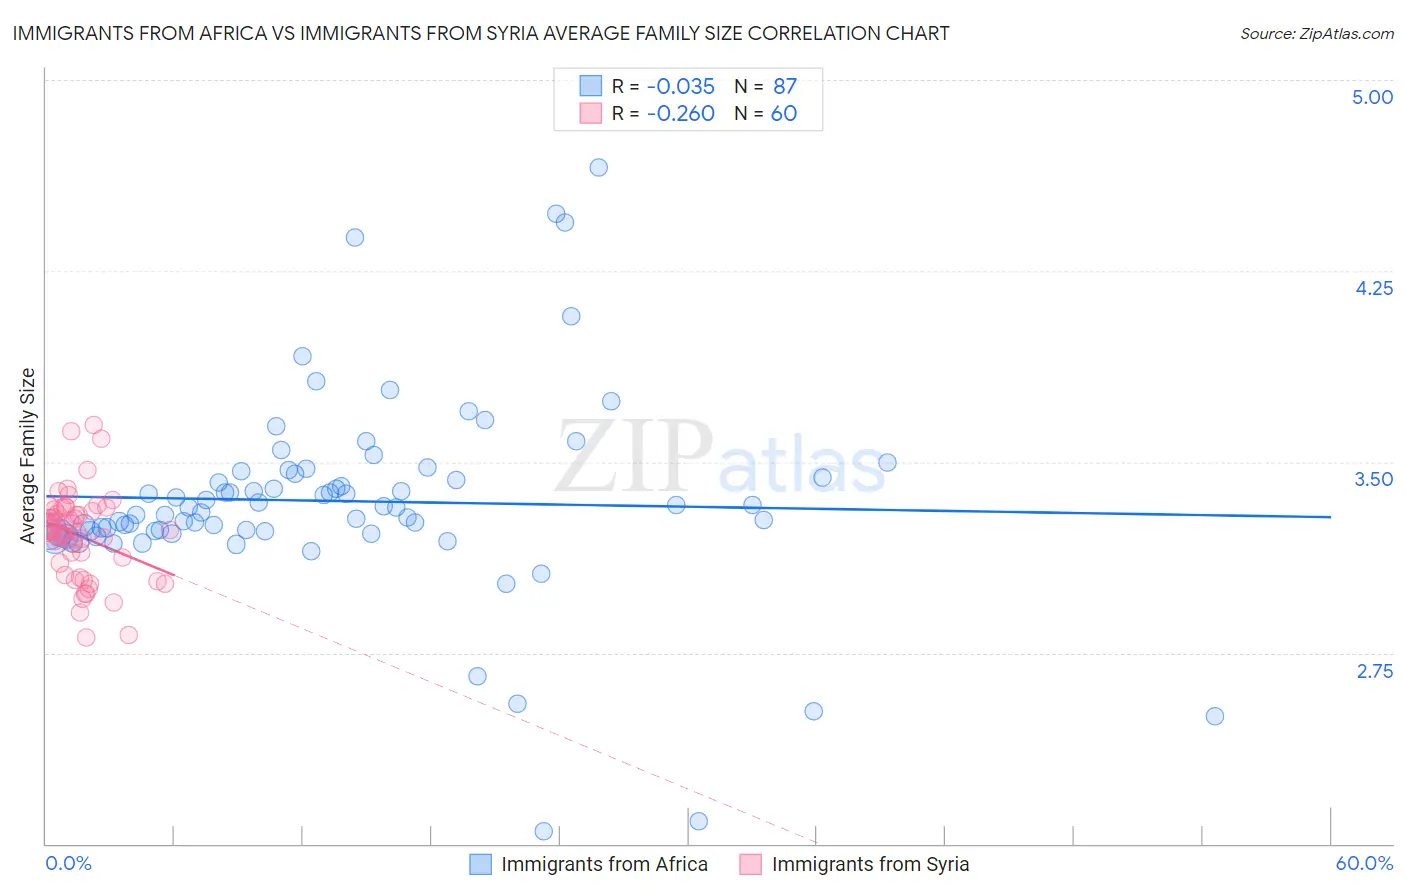
Immigrants from Africa vs Immigrants from Syria Average Family Size Correlation Chart
The statistical analysis conducted on geographies consisting of 468,951,664 people shows no correlation between the proportion of Immigrants from Africa and average family size in the United States with a correlation coefficient (R) of -0.035 and weighted average of 3.25. Similarly, the statistical analysis conducted on geographies consisting of 174,105,874 people shows a weak negative correlation between the proportion of Immigrants from Syria and average family size in the United States with a correlation coefficient (R) of -0.260 and weighted average of 3.26, a difference of 0.46%.
Average Family Size Correlation Summary
| Measurement | Immigrants from Africa | Immigrants from Syria |
| Minimum | 2.05 | 2.81 |
| Maximum | 4.66 | 3.64 |
| Range | 2.61 | 0.83 |
| Mean | 3.35 | 3.21 |
| Median | 3.32 | 3.23 |
| Interquartile 25% (IQ1) | 3.23 | 3.08 |
| Interquartile 75% (IQ3) | 3.45 | 3.31 |
| Interquartile Range (IQR) | 0.23 | 0.23 |
| Standard Deviation (Sample) | 0.40 | 0.17 |
| Standard Deviation (Population) | 0.40 | 0.17 |
Demographics Similar to Immigrants from Africa and Immigrants from Syria by Average Family Size
In terms of average family size, the demographic groups most similar to Immigrants from Africa are Armenian (3.25, a difference of 0.010%), Tsimshian (3.25, a difference of 0.060%), Liberian (3.25, a difference of 0.090%), Bhutanese (3.25, a difference of 0.090%), and Subsaharan African (3.25, a difference of 0.10%). Similarly, the demographic groups most similar to Immigrants from Syria are Immigrants from Costa Rica (3.26, a difference of 0.010%), Colombian (3.26, a difference of 0.040%), Immigrants from Hong Kong (3.26, a difference of 0.10%), Laotian (3.26, a difference of 0.10%), and Immigrants from Western Asia (3.26, a difference of 0.13%).
| Demographics | Rating | Rank | Average Family Size |
| Immigrants | Costa Rica | 90.7 /100 | #126 | Exceptional 3.26 |
| Immigrants | Syria | 90.6 /100 | #127 | Exceptional 3.26 |
| Colombians | 89.9 /100 | #128 | Excellent 3.26 |
| Immigrants | Hong Kong | 88.6 /100 | #129 | Excellent 3.26 |
| Laotians | 88.5 /100 | #130 | Excellent 3.26 |
| Immigrants | Western Asia | 87.7 /100 | #131 | Excellent 3.26 |
| Costa Ricans | 86.8 /100 | #132 | Excellent 3.26 |
| Immigrants | Venezuela | 86.3 /100 | #133 | Excellent 3.26 |
| Africans | 84.9 /100 | #134 | Excellent 3.25 |
| Panamanians | 84.2 /100 | #135 | Excellent 3.25 |
| Comanche | 82.8 /100 | #136 | Excellent 3.25 |
| Immigrants | Middle Africa | 82.4 /100 | #137 | Excellent 3.25 |
| Cubans | 81.8 /100 | #138 | Excellent 3.25 |
| Immigrants | Ethiopia | 81.6 /100 | #139 | Excellent 3.25 |
| Sub-Saharan Africans | 81.6 /100 | #140 | Excellent 3.25 |
| Venezuelans | 81.4 /100 | #141 | Excellent 3.25 |
| Liberians | 81.2 /100 | #142 | Excellent 3.25 |
| Bhutanese | 81.0 /100 | #143 | Excellent 3.25 |
| Tsimshian | 80.2 /100 | #144 | Excellent 3.25 |
| Armenians | 78.2 /100 | #145 | Good 3.25 |
| Immigrants | Africa | 77.9 /100 | #146 | Good 3.25 |