Immigrants from Africa vs Immigrants from Honduras Family Households
COMPARE
Immigrants from Africa
Immigrants from Honduras
Family Households
Family Households Comparison
Immigrants from Africa
Immigrants from Honduras
62.4%
FAMILY HOUSEHOLDS
0.0/ 100
METRIC RATING
300th/ 347
METRIC RANK
64.2%
FAMILY HOUSEHOLDS
35.0/ 100
METRIC RATING
180th/ 347
METRIC RANK
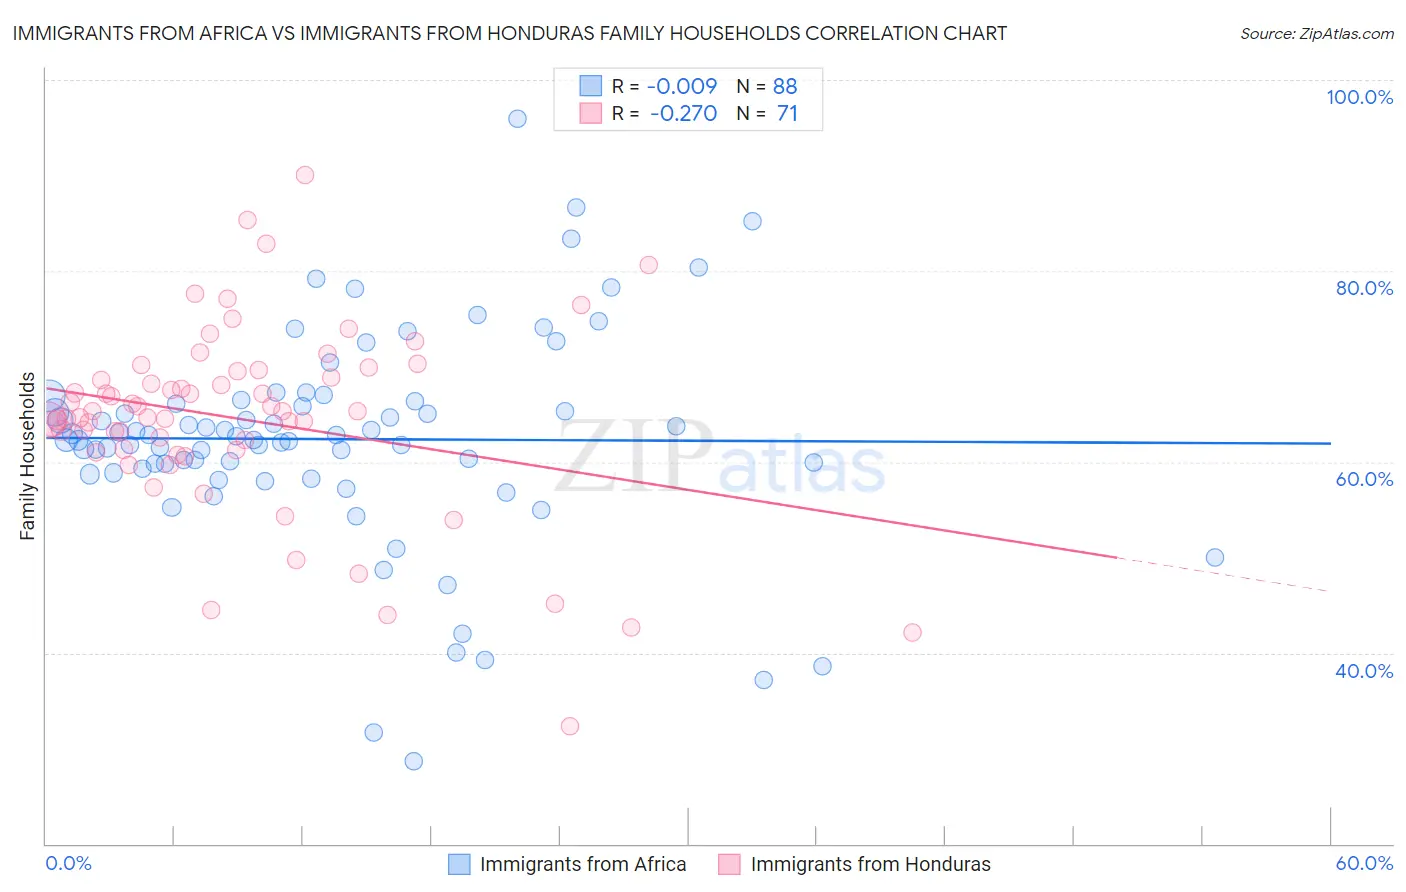
Immigrants from Africa vs Immigrants from Honduras Family Households Correlation Chart
The statistical analysis conducted on geographies consisting of 468,955,500 people shows no correlation between the proportion of Immigrants from Africa and percentage of family households in the United States with a correlation coefficient (R) of -0.009 and weighted average of 62.4%. Similarly, the statistical analysis conducted on geographies consisting of 322,466,893 people shows a weak negative correlation between the proportion of Immigrants from Honduras and percentage of family households in the United States with a correlation coefficient (R) of -0.270 and weighted average of 64.2%, a difference of 2.9%.
Family Households Correlation Summary
| Measurement | Immigrants from Africa | Immigrants from Honduras |
| Minimum | 28.7% | 32.4% |
| Maximum | 96.0% | 90.0% |
| Range | 67.3% | 57.7% |
| Mean | 62.4% | 64.5% |
| Median | 62.5% | 65.3% |
| Interquartile 25% (IQ1) | 59.1% | 61.2% |
| Interquartile 75% (IQ3) | 66.2% | 69.4% |
| Interquartile Range (IQR) | 7.2% | 8.2% |
| Standard Deviation (Sample) | 11.2% | 10.0% |
| Standard Deviation (Population) | 11.1% | 9.9% |
Similar Demographics by Family Households
Demographics Similar to Immigrants from Africa by Family Households
In terms of family households, the demographic groups most similar to Immigrants from Africa are Immigrants from Kuwait (62.4%, a difference of 0.0%), Immigrants from Albania (62.4%, a difference of 0.020%), Immigrants from Kenya (62.3%, a difference of 0.060%), Immigrants from Spain (62.4%, a difference of 0.070%), and French American Indian (62.4%, a difference of 0.090%).
| Demographics | Rating | Rank | Family Households |
| Immigrants | Sweden | 0.0 /100 | #293 | Tragic 62.5% |
| Barbadians | 0.0 /100 | #294 | Tragic 62.5% |
| Okinawans | 0.0 /100 | #295 | Tragic 62.5% |
| Slovenes | 0.0 /100 | #296 | Tragic 62.4% |
| French American Indians | 0.0 /100 | #297 | Tragic 62.4% |
| Immigrants | Spain | 0.0 /100 | #298 | Tragic 62.4% |
| Immigrants | Kuwait | 0.0 /100 | #299 | Tragic 62.4% |
| Immigrants | Africa | 0.0 /100 | #300 | Tragic 62.4% |
| Immigrants | Albania | 0.0 /100 | #301 | Tragic 62.4% |
| Immigrants | Kenya | 0.0 /100 | #302 | Tragic 62.3% |
| Cree | 0.0 /100 | #303 | Tragic 62.3% |
| Iroquois | 0.0 /100 | #304 | Tragic 62.2% |
| Bermudans | 0.0 /100 | #305 | Tragic 62.2% |
| Africans | 0.0 /100 | #306 | Tragic 62.1% |
| Immigrants | Norway | 0.0 /100 | #307 | Tragic 62.1% |
Demographics Similar to Immigrants from Honduras by Family Households
In terms of family households, the demographic groups most similar to Immigrants from Honduras are Immigrants from Trinidad and Tobago (64.2%, a difference of 0.0%), Ukrainian (64.2%, a difference of 0.0%), Creek (64.2%, a difference of 0.010%), Puerto Rican (64.2%, a difference of 0.020%), and Immigrants from Ukraine (64.2%, a difference of 0.050%).
| Demographics | Rating | Rank | Family Households |
| Immigrants | Sierra Leone | 52.5 /100 | #173 | Average 64.3% |
| Immigrants | Germany | 50.0 /100 | #174 | Average 64.3% |
| Bangladeshis | 44.3 /100 | #175 | Average 64.3% |
| Vietnamese | 43.6 /100 | #176 | Average 64.2% |
| Immigrants | Micronesia | 42.3 /100 | #177 | Average 64.2% |
| Jamaicans | 40.6 /100 | #178 | Average 64.2% |
| Immigrants | Ukraine | 38.2 /100 | #179 | Fair 64.2% |
| Immigrants | Honduras | 35.0 /100 | #180 | Fair 64.2% |
| Immigrants | Trinidad and Tobago | 34.9 /100 | #181 | Fair 64.2% |
| Ukrainians | 34.6 /100 | #182 | Fair 64.2% |
| Creek | 34.1 /100 | #183 | Fair 64.2% |
| Puerto Ricans | 33.4 /100 | #184 | Fair 64.2% |
| Immigrants | Iran | 30.4 /100 | #185 | Fair 64.1% |
| Spanish Americans | 30.1 /100 | #186 | Fair 64.1% |
| Northern Europeans | 28.2 /100 | #187 | Fair 64.1% |