Hopi vs Icelander Average Family Size
COMPARE
Hopi
Icelander
Average Family Size
Average Family Size Comparison
Hopi
Icelanders
3.60
AVERAGE FAMILY SIZE
100.0/ 100
METRIC RATING
9th/ 347
METRIC RANK
3.19
AVERAGE FAMILY SIZE
5.2/ 100
METRIC RATING
230th/ 347
METRIC RANK
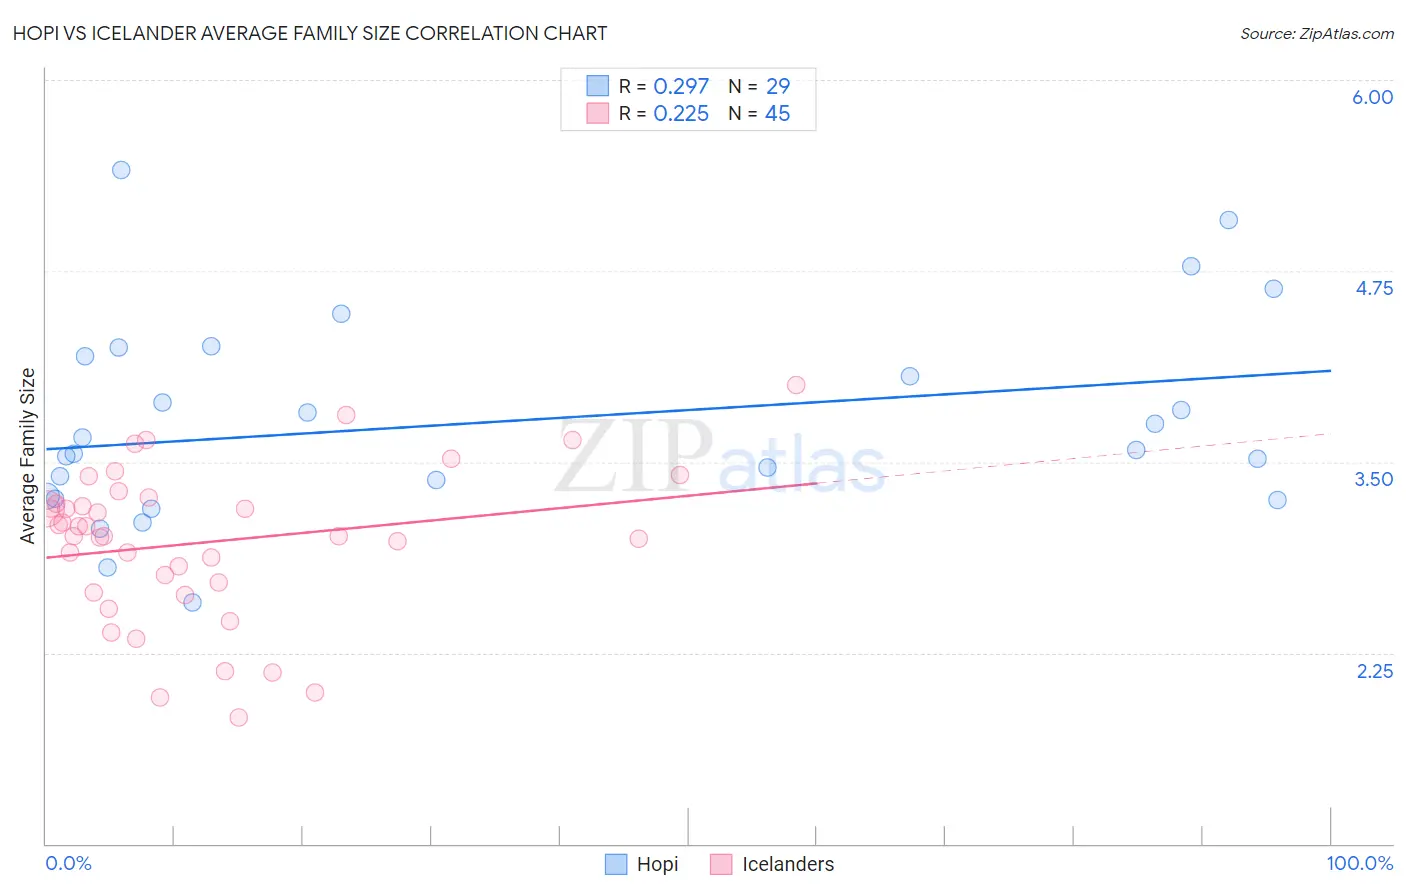
Hopi vs Icelander Average Family Size Correlation Chart
The statistical analysis conducted on geographies consisting of 74,733,485 people shows a weak positive correlation between the proportion of Hopi and average family size in the United States with a correlation coefficient (R) of 0.297 and weighted average of 3.60. Similarly, the statistical analysis conducted on geographies consisting of 159,626,444 people shows a weak positive correlation between the proportion of Icelanders and average family size in the United States with a correlation coefficient (R) of 0.225 and weighted average of 3.19, a difference of 12.9%.
Average Family Size Correlation Summary
| Measurement | Hopi | Icelander |
| Minimum | 2.58 | 1.83 |
| Maximum | 5.41 | 4.00 |
| Range | 2.83 | 2.17 |
| Mean | 3.76 | 2.97 |
| Median | 3.58 | 3.02 |
| Interquartile 25% (IQ1) | 3.27 | 2.68 |
| Interquartile 75% (IQ3) | 4.22 | 3.25 |
| Interquartile Range (IQR) | 0.95 | 0.57 |
| Standard Deviation (Sample) | 0.67 | 0.50 |
| Standard Deviation (Population) | 0.65 | 0.49 |
Similar Demographics by Average Family Size
Demographics Similar to Hopi by Average Family Size
In terms of average family size, the demographic groups most similar to Hopi are Immigrants from Yemen (3.60, a difference of 0.010%), Spanish American Indian (3.58, a difference of 0.35%), Inupiat (3.63, a difference of 0.87%), Arapaho (3.64, a difference of 1.1%), and Navajo (3.65, a difference of 1.4%).
| Demographics | Rating | Rank | Average Family Size |
| Crow | 100 /100 | #2 | Exceptional 3.82 |
| Pueblo | 100 /100 | #3 | Exceptional 3.79 |
| Pima | 100 /100 | #4 | Exceptional 3.75 |
| Navajo | 100.0 /100 | #5 | Exceptional 3.65 |
| Arapaho | 100.0 /100 | #6 | Exceptional 3.64 |
| Inupiat | 100.0 /100 | #7 | Exceptional 3.63 |
| Immigrants | Yemen | 100.0 /100 | #8 | Exceptional 3.60 |
| Hopi | 100.0 /100 | #9 | Exceptional 3.60 |
| Spanish American Indians | 100.0 /100 | #10 | Exceptional 3.58 |
| Tohono O'odham | 100.0 /100 | #11 | Exceptional 3.53 |
| Immigrants | Mexico | 100.0 /100 | #12 | Exceptional 3.52 |
| Sioux | 100.0 /100 | #13 | Exceptional 3.52 |
| Immigrants | Central America | 100.0 /100 | #14 | Exceptional 3.49 |
| Tongans | 100.0 /100 | #15 | Exceptional 3.49 |
| Ute | 100.0 /100 | #16 | Exceptional 3.49 |
Demographics Similar to Icelanders by Average Family Size
In terms of average family size, the demographic groups most similar to Icelanders are Basque (3.19, a difference of 0.0%), Immigrants from Italy (3.19, a difference of 0.010%), Cherokee (3.18, a difference of 0.040%), Nonimmigrants (3.19, a difference of 0.050%), and Portuguese (3.19, a difference of 0.070%).
| Demographics | Rating | Rank | Average Family Size |
| Immigrants | Zimbabwe | 7.1 /100 | #223 | Tragic 3.19 |
| Syrians | 6.5 /100 | #224 | Tragic 3.19 |
| Cree | 6.2 /100 | #225 | Tragic 3.19 |
| Chickasaw | 6.0 /100 | #226 | Tragic 3.19 |
| Portuguese | 6.0 /100 | #227 | Tragic 3.19 |
| Immigrants | Nonimmigrants | 5.7 /100 | #228 | Tragic 3.19 |
| Immigrants | Italy | 5.3 /100 | #229 | Tragic 3.19 |
| Icelanders | 5.2 /100 | #230 | Tragic 3.19 |
| Basques | 5.2 /100 | #231 | Tragic 3.19 |
| Cherokee | 4.7 /100 | #232 | Tragic 3.18 |
| Brazilians | 4.5 /100 | #233 | Tragic 3.18 |
| Iranians | 4.5 /100 | #234 | Tragic 3.18 |
| Immigrants | Turkey | 4.2 /100 | #235 | Tragic 3.18 |
| Immigrants | Portugal | 4.2 /100 | #236 | Tragic 3.18 |
| Immigrants | Romania | 3.7 /100 | #237 | Tragic 3.18 |