Hmong vs Cypriot Married-couple Households
COMPARE
Hmong
Cypriot
Married-couple Households
Married-couple Households Comparison
Hmong
Cypriots
47.0%
MARRIED-COUPLE HOUSEHOLDS
76.2/ 100
METRIC RATING
153rd/ 347
METRIC RANK
48.0%
MARRIED-COUPLE HOUSEHOLDS
97.2/ 100
METRIC RATING
89th/ 347
METRIC RANK
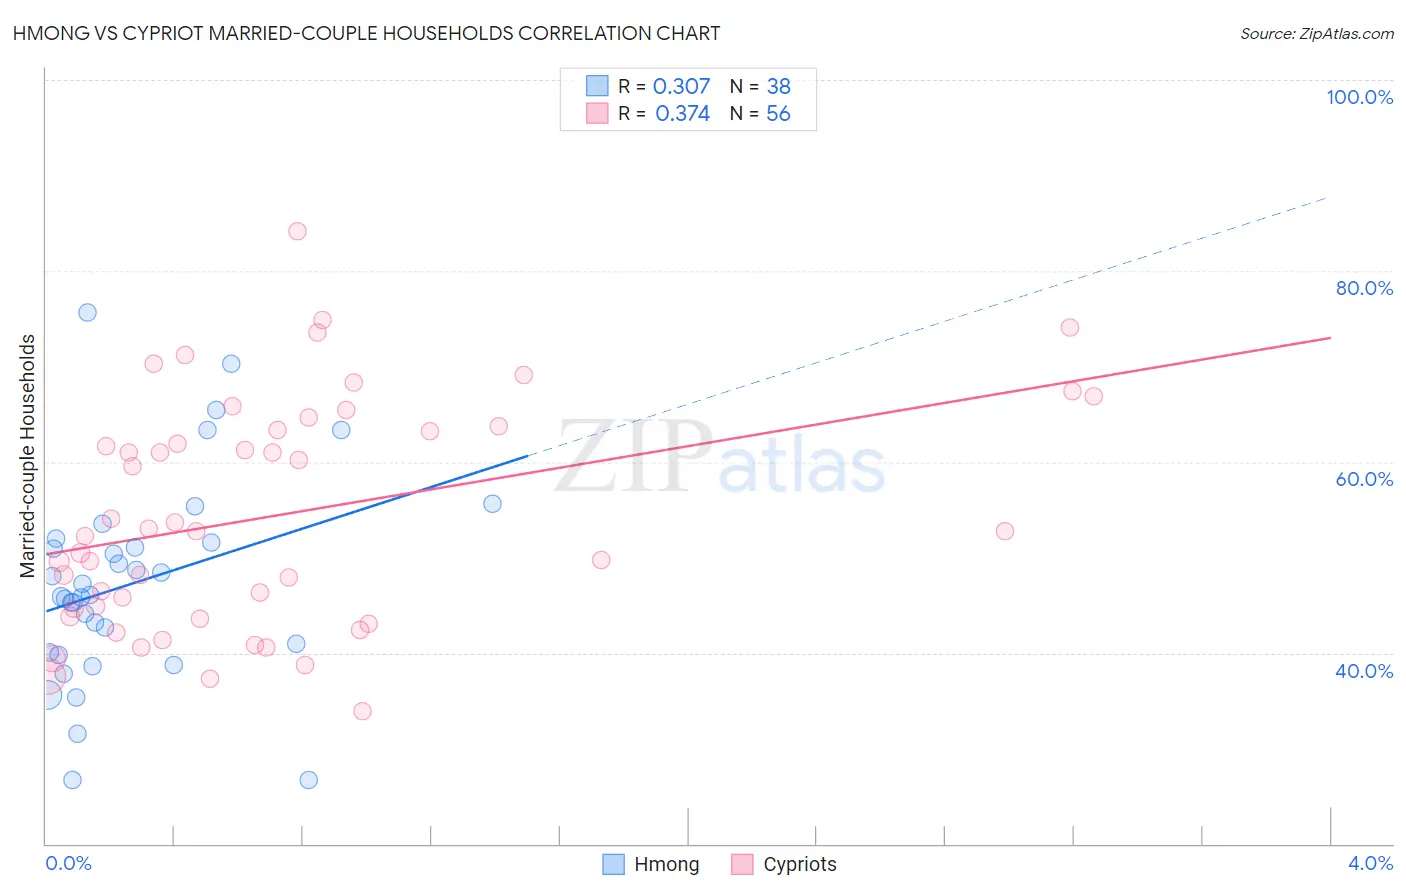
Hmong vs Cypriot Married-couple Households Correlation Chart
The statistical analysis conducted on geographies consisting of 24,669,739 people shows a mild positive correlation between the proportion of Hmong and percentage of married-couple family households in the United States with a correlation coefficient (R) of 0.307 and weighted average of 47.0%. Similarly, the statistical analysis conducted on geographies consisting of 61,857,015 people shows a mild positive correlation between the proportion of Cypriots and percentage of married-couple family households in the United States with a correlation coefficient (R) of 0.374 and weighted average of 48.0%, a difference of 2.2%.
Married-couple Households Correlation Summary
| Measurement | Hmong | Cypriot |
| Minimum | 26.6% | 33.8% |
| Maximum | 75.6% | 84.2% |
| Range | 49.0% | 50.4% |
| Mean | 47.3% | 54.4% |
| Median | 46.0% | 52.8% |
| Interquartile 25% (IQ1) | 40.1% | 44.2% |
| Interquartile 75% (IQ3) | 51.6% | 63.6% |
| Interquartile Range (IQR) | 11.5% | 19.3% |
| Standard Deviation (Sample) | 10.7% | 11.9% |
| Standard Deviation (Population) | 10.6% | 11.8% |
Similar Demographics by Married-couple Households
Demographics Similar to Hmong by Married-couple Households
In terms of married-couple households, the demographic groups most similar to Hmong are Immigrants from Western Asia (46.9%, a difference of 0.0%), Serbian (47.0%, a difference of 0.010%), Arab (46.9%, a difference of 0.010%), Immigrants from Bulgaria (47.0%, a difference of 0.030%), and Armenian (46.9%, a difference of 0.040%).
| Demographics | Rating | Rank | Married-couple Households |
| Immigrants | Western Europe | 81.6 /100 | #146 | Excellent 47.1% |
| Immigrants | Syria | 81.6 /100 | #147 | Excellent 47.1% |
| Icelanders | 79.5 /100 | #148 | Good 47.0% |
| Paraguayans | 78.7 /100 | #149 | Good 47.0% |
| Immigrants | Russia | 77.6 /100 | #150 | Good 47.0% |
| Immigrants | Bulgaria | 76.8 /100 | #151 | Good 47.0% |
| Serbians | 76.3 /100 | #152 | Good 47.0% |
| Hmong | 76.2 /100 | #153 | Good 47.0% |
| Immigrants | Western Asia | 76.1 /100 | #154 | Good 46.9% |
| Arabs | 76.0 /100 | #155 | Good 46.9% |
| Armenians | 75.4 /100 | #156 | Good 46.9% |
| Immigrants | Oceania | 74.8 /100 | #157 | Good 46.9% |
| Immigrants | Nonimmigrants | 73.3 /100 | #158 | Good 46.9% |
| Osage | 73.2 /100 | #159 | Good 46.9% |
| Iraqis | 71.7 /100 | #160 | Good 46.9% |
Demographics Similar to Cypriots by Married-couple Households
In terms of married-couple households, the demographic groups most similar to Cypriots are French (48.0%, a difference of 0.010%), Immigrants from Ireland (48.0%, a difference of 0.030%), Afghan (48.0%, a difference of 0.030%), Belgian (48.0%, a difference of 0.050%), and Immigrants from Israel (48.0%, a difference of 0.070%).
| Demographics | Rating | Rank | Married-couple Households |
| Immigrants | Poland | 97.7 /100 | #82 | Exceptional 48.1% |
| Guamanians/Chamorros | 97.6 /100 | #83 | Exceptional 48.1% |
| Ukrainians | 97.6 /100 | #84 | Exceptional 48.1% |
| Immigrants | Israel | 97.4 /100 | #85 | Exceptional 48.0% |
| Belgians | 97.4 /100 | #86 | Exceptional 48.0% |
| Immigrants | Ireland | 97.3 /100 | #87 | Exceptional 48.0% |
| Afghans | 97.3 /100 | #88 | Exceptional 48.0% |
| Cypriots | 97.2 /100 | #89 | Exceptional 48.0% |
| French | 97.2 /100 | #90 | Exceptional 48.0% |
| Immigrants | Moldova | 97.0 /100 | #91 | Exceptional 48.0% |
| Palestinians | 96.9 /100 | #92 | Exceptional 48.0% |
| Lebanese | 96.9 /100 | #93 | Exceptional 47.9% |
| Americans | 96.9 /100 | #94 | Exceptional 47.9% |
| Immigrants | Belgium | 96.8 /100 | #95 | Exceptional 47.9% |
| Immigrants | Egypt | 96.6 /100 | #96 | Exceptional 47.9% |